Exam 2: Observing and Explaining the Economy
Exam 1: The Central Idea100 Questions
Exam 2: Observing and Explaining the Economy129 Questions
Exam 3: The Supply and Demand Model149 Questions
Exam 4: Subtleties of the Supply and Demand Model173 Questions
Exam 5: Macroeconomics: the Big Picture155 Questions
Exam 6: Measuring the Production, Income, and Spending of Nations175 Questions
Exam 7: The Spending Allocation Model166 Questions
Exam 8: Unemployment and Employment213 Questions
Exam 9: Productivity and Economic Growth159 Questions
Exam 10: Money and Inflation153 Questions
Exam 11: The Nature and Causes of Economic Fluctuations182 Questions
Exam 12: The Economic Fluctuations Model206 Questions
Exam 13: Using the Economic Fluctuations Model177 Questions
Exam 14: Fiscal Policy138 Questions
Exam 15: Monetary Policy176 Questions
Exam 16: Capital and Financial Markets189 Questions
Exam 17: Economic Growth Around the World157 Questions
Exam 18: International Trade234 Questions
Exam 19: International Finance125 Questions
Select questions type
Exhibit 2A-6 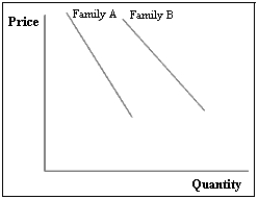 -Exhibit 2A-6 shows the relationship between the price of sodas and the quantities that two families are willing to buy. Suppose that both families are willing to buy more sodas while the soda price remain constant. Which of the following is correct?
Free
(Multiple Choice)
4.8/5  (32)
(32)
Correct Answer: Verified
A
Consider an economic model of tablet production, which depends on the number of workers. Represent this model graphically, algebraically, and verbally.
Tablets Workers 0 0 20 1 40 2 60 3 80 4
Free
(Essay)
4.7/5 (40)
Correct Answer:Verified
Graphically: 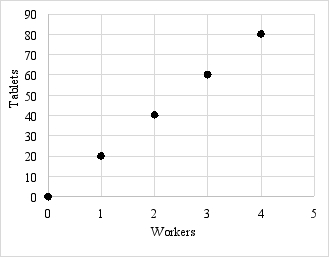 Algebraically:
Using the information in the table, the relationship between the number of tablets and the number of workers can be expressed as Tablets = 20 × Workers.
Verbally:
The information in the table indicates a positive and linear relationship between the number of workers and the production of tablets. In other words, as the number of workers increases, the production of tablets also increases.
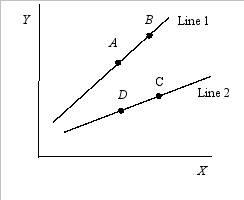
Exhibit 2A-5
 True/False
-According to Exhibit 2A-5, the slope of line 1 may be 1.25, whereas the slope of line 2 may be .75.
True/False
-According to Exhibit 2A-5, the slope of line 1 may be 1.25, whereas the slope of line 2 may be .75.
Free
(True/False)
4.8/5 (39)
Correct Answer:Verified
True
Which of the following is most likely a microeconomic concept?
(Multiple Choice)
4.8/5 (32)
Economists develop new models only when new economic data become available.
(True/False)
4.8/5 (27)
The table below shows the inflation rate for the period 2006 through 2016. Suppose you wanted to show that there was not much variation in the inflation rate over this period. How would you represent this table in a graph? Suppose you wanted to show that there was a large amount of variation during this period. How would you represent this table in a graph?
Year Inflition R.te 2006 3.2 2007 2.9 2008 3.8 2009 -[1.3 2010 1.6 2011 3.1 2012 2.1 2013 1.5 2014 1.6 2015 0.1 2016 1.3
(Essay)
4.9/5 (28)
The relative price of gasoline has decreased since 2012 because we have paid more dollars for each gallon of gasoline.
(True/False)
4.9/5 (32)
In his book Wealth of Nations, Adam Smith made a positive statement when he advocated about what the government should or should not do to affect an economy.
(True/False)
4.9/5 (40)
Exhibit 2A-3 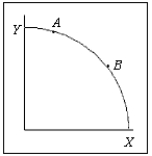 -A relationship showing that exam grades are positively related to hours of study can be described by a curve that
(Multiple Choice)
4.9/5 (42)
The category of economics that contains statements about what ought to be is known as
(Multiple Choice)
5.0/5 (36)
Explain how the distinction between positive and normative economics provides insight as to why economists do disagree.
(Essay)
4.8/5 (35)
All of the following are what economists commonly do except
(Multiple Choice)
4.8/5 (45)
Explain why economics requires historical and philosophical skills in addition to analytical skills.
(Essay)
4.9/5 (35)
Exhibit 2A-8 X Y 25 60 33 69 40 76 42 78 jT
True/False
-There is a linear relationship between X and Y in Exhibit 2A-8.
(True/False)
4.9/5 (37)
Suppose you decide to build a model to explain why some companies earned more profits in the past year than others did.
(A) What data wauld yau collect?
(B) What variable do you believe wauld supply the major part of the explanation of the rariation in profits?
(C) If you graph the data winth profits an the vertical gods and your explanatory variable an the horizontal axis, will the relationship be upward sloping or downward sloping?
(D) What does your answer in part (C) imply far whether the data an profits and the data an yaur exglanatory variable are positvely ar negatively carrelated?
(Essay)
4.7/5 (35)
Filters
- Essay(0)
- Multiple Choice(0)
- Short Answer(0)
- True False(0)
- Matching(0)