Exam 2: Observing and Explaining the Economy
Exam 1: The Central Idea100 Questions
Exam 2: Observing and Explaining the Economy129 Questions
Exam 3: The Supply and Demand Model149 Questions
Exam 4: Subtleties of the Supply and Demand Model173 Questions
Exam 5: Macroeconomics: the Big Picture155 Questions
Exam 6: Measuring the Production, Income, and Spending of Nations175 Questions
Exam 7: The Spending Allocation Model166 Questions
Exam 8: Unemployment and Employment213 Questions
Exam 9: Productivity and Economic Growth159 Questions
Exam 10: Money and Inflation153 Questions
Exam 11: The Nature and Causes of Economic Fluctuations182 Questions
Exam 12: The Economic Fluctuations Model206 Questions
Exam 13: Using the Economic Fluctuations Model177 Questions
Exam 14: Fiscal Policy138 Questions
Exam 15: Monetary Policy176 Questions
Exam 16: Capital and Financial Markets189 Questions
Exam 17: Economic Growth Around the World157 Questions
Exam 18: International Trade234 Questions
Exam 19: International Finance125 Questions
Select questions type
A microeconomic model must be much smaller in size than a macroeconomic model.
(True/False)
4.9/5  (31)
(31)
Most disagreements between economists occur because of different data sources.
(True/False)
4.8/5 (35)
Economics has always been a good example of an experimental science.
(True/False)
4.8/5 (37)
Exhibit 2A-5
 True/False
-Refer to Exhibit 2A-5. The movement from A to B is called a
True/False
-Refer to Exhibit 2A-5. The movement from A to B is called a
(Multiple Choice)
4.9/5 (30)
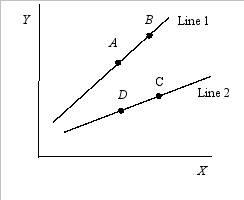
Exhibit 2A-4 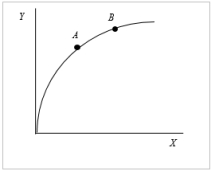 -Refer to Exhibit 2A-4. The slope of the relationship between X and Y is
(Multiple Choice)
4.9/5 (26)
To see whether the price of gasoline has risen compared to the prices of other goods and services, one would calculate
(Multiple Choice)
4.8/5 (25)
When economists do disagree, the disagreement most likely concerns
(Multiple Choice)
4.8/5 (30)
Economists are likely to evaluate the impacts of rising gasoline prices through the use of
(Multiple Choice)
4.9/5 (29)
An economic model is a tool used to help us understand the real world.
(True/False)
4.8/5 (37)
Explain why it is more difficult to determine causality in economics than in other sciences such as physics, chemistry, and biology.
(Essay)
4.8/5 (31)
Explain the purpose of each of the following types of graphs:
(A) Time-5eries 파매
(B) Scatter plot
(C) Pie chart
(Essay)
4.9/5 (37)
What problems would arise if economists did not make ceteris paribus assumptions when making predictions?
(Essay)
4.9/5 (39)
Filters
- Essay(0)
- Multiple Choice(0)
- Short Answer(0)
- True False(0)
- Matching(0)