Exam 2: Observing and Explaining the Economy
Exam 1: The Central Idea100 Questions
Exam 2: Observing and Explaining the Economy129 Questions
Exam 3: The Supply and Demand Model149 Questions
Exam 4: Subtleties of the Supply and Demand Model173 Questions
Exam 5: Macroeconomics: the Big Picture155 Questions
Exam 6: Measuring the Production, Income, and Spending of Nations175 Questions
Exam 7: The Spending Allocation Model166 Questions
Exam 8: Unemployment and Employment213 Questions
Exam 9: Productivity and Economic Growth159 Questions
Exam 10: Money and Inflation153 Questions
Exam 11: The Nature and Causes of Economic Fluctuations182 Questions
Exam 12: The Economic Fluctuations Model206 Questions
Exam 13: Using the Economic Fluctuations Model177 Questions
Exam 14: Fiscal Policy138 Questions
Exam 15: Monetary Policy176 Questions
Exam 16: Capital and Financial Markets189 Questions
Exam 17: Economic Growth Around the World157 Questions
Exam 18: International Trade234 Questions
Exam 19: International Finance125 Questions
Select questions type
The figure below shows the relationship of the quantity demanded for iTune music downloads per day to the price of each iTune music download. 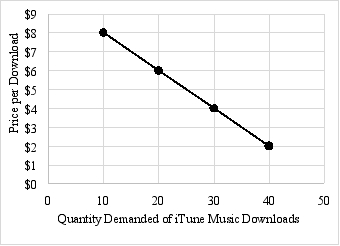 (A) If the price of iTune music dommlaats increases fram 12 per dommaad to 14 per domidaad by how much will the quantity demanded for iTune music dowrloads change?
(B) Eolnan how yaur anser in part (A) relies on the ceteris paribm assumption.
(A) If the price of iTune music dommlaats increases fram 12 per dommaad to 14 per domidaad by how much will the quantity demanded for iTune music dowrloads change?
(B) Eolnan how yaur anser in part (A) relies on the ceteris paribm assumption.
(Essay)
4.8/5  (36)
(36)
"Inflation is a more serious problem than unemployment." This statement is an example of
(Multiple Choice)
4.8/5 (35)
Identify whether the following issues are macroeconomic or microeconomic and explain why you categorized them in that way.
(A) The Prowth rate of real GDP
(B) A government policy that guarantees a minimum price of agricultural goods
(C) A tax an restaurant meals
(D) A government policy to affect the increase in the overall price level
(Essay)
4.8/5 (38)
Indicate whether you expect positive or negative correlation for the following pairs of variables. For each pair, state whether causation exists.
(A) The use of sunglasses and the munber of sunny days.
(B) The number of movie rentals and the number of cable subscriptions
(C) Purchases of canty and purchases of Valentine's Day carts.
(Essay)
4.8/5 (38)
Exhibit 2A-2 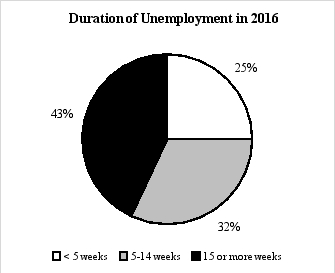 -Suppose in 2016, on average, 10 million people were unemployed. According to Exhibit 2A-2, how many of these people had been unemployed for less than five weeks?
(Multiple Choice)
4.8/5 (28)
Describe an experiment that you would run to see how market prices are determined. Also be sure to explain where the ceteris paribus assumption is needed.
(Essay)
4.8/5 (33)
A two-dimensional graph cannot be used to show what will happen to the relationship between X and Y if any of the ceteris paribus assumptions change.
(True/False)
5.0/5 (28)
Whether a nation should have more or less government involvement is basically a
(Multiple Choice)
4.7/5 (36)
Exhibit 2A-3  -A curve shows that every time family income increases by $1, spending increases by $.75. This curve would
(Multiple Choice)
4.8/5 (39)
Exhibit 2A-7 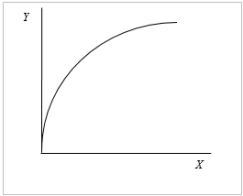 -Exhibit 2A-7 shows the relationship between X and Y. The slope of the relationship is
(Multiple Choice)
4.8/5 (39)
All of the following are examples of an economic variable except
(Multiple Choice)
4.8/5 (35)
Consider a ratio for the total number of miles traveled by car divided by the total number of drivers.
(A) If bath the total mumber af miles traveled by car and the total number af mivers increase aver time, what must be tue far the ratid ta rise aver time?
(B) If both the tatal number of miles taveled by car and the tatal number af arivers fall aver time, what must be true for the ratid to rise cver time?
(C) If the ratio is not changing aver time, what must be tue about the total number of miles taveled by car and the total number of drvers aver time, and relative to each ather?
(Essay)
5.0/5 (34)
If the price of gasoline decreases but not as much as the decrease in the average price of other goods and services, then the relative price of gasoline
(Multiple Choice)
4.8/5 (32)
Exhibit 2A-8 X Y 25 60 33 69 40 76 42 78 jT
True/False
-The slope of the relationship between X and Y is positive in Exhibit 2A-8.
(True/False)
4.9/5 (43)
Exhibit 2A-2
-The type of chart shown in Exhibit 2A-2 is referred to as a
(Multiple Choice)
4.9/5 (36)
Explaining why the vehicle miles traveled per person have risen in recent years is one example of what economists do.
(True/False)
4.9/5 (31)
Filters
- Essay(0)
- Multiple Choice(0)
- Short Answer(0)
- True False(0)
- Matching(0)