Exam 13: Using the Economic Fluctuations Model
Exam 1: The Central Idea100 Questions
Exam 2: Observing and Explaining the Economy129 Questions
Exam 3: The Supply and Demand Model149 Questions
Exam 4: Subtleties of the Supply and Demand Model173 Questions
Exam 5: Macroeconomics: the Big Picture155 Questions
Exam 6: Measuring the Production, Income, and Spending of Nations175 Questions
Exam 7: The Spending Allocation Model166 Questions
Exam 8: Unemployment and Employment213 Questions
Exam 9: Productivity and Economic Growth159 Questions
Exam 10: Money and Inflation153 Questions
Exam 11: The Nature and Causes of Economic Fluctuations182 Questions
Exam 12: The Economic Fluctuations Model206 Questions
Exam 13: Using the Economic Fluctuations Model177 Questions
Exam 14: Fiscal Policy138 Questions
Exam 15: Monetary Policy176 Questions
Exam 16: Capital and Financial Markets189 Questions
Exam 17: Economic Growth Around the World157 Questions
Exam 18: International Trade234 Questions
Exam 19: International Finance125 Questions
Select questions type
Exhibit 25-2 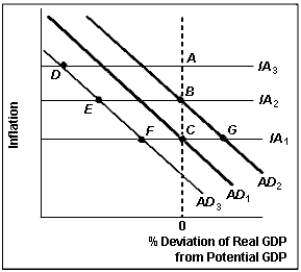 -According to Exhibit 25-2, which point best represents where the U.S. economy was in 2009?
(Multiple Choice)
4.8/5  (28)
(28)
Stagflation refers to the situation in which inflation is up and real GDP is down.
(True/False)
4.8/5 (40)
Among the factors that might have led to the outbreak of the 2007-09 recession, which most likely caused a shift of the IA line instead of the AD curve?
(Multiple Choice)
4.8/5 (32)
Draw an aggregate demand inflation adjustment diagram that illustrates the path of inflation and the percentage deviation of real GDP from potential for the U.S. economy from 2007 to 2009.
(Essay)
4.8/5 (36)
When government purchases decrease, the short-run effect can be described as the period of time when
(Multiple Choice)
4.8/5 (44)
Which of the following was not a factor that led to the recession that began at the end of 2007?
(Multiple Choice)
4.8/5 (47)
Suppose the relationship between real GDP and inflation is depicted as shown in the table below. Assume that real and potential GDP are equal to each other at $5,400 billion. Suppose government purchases decline by $100 billion and the slope of the aggregate expenditure line is 0.5. Inflation 9 7 5 3 1 Real GDP 5,200 5,300 5,400 5,500 5,600 (A) Esplan how the curve is affected by this change. In the shart run, what will real GDP and the rate of inflation be?
(B) Using the and curves, show what will heppen in the mediun run Be sure to grive an economic exalanation far what is happening
(C) Using the and curves, show what will happen in the lang run.
(Essay)
4.9/5 (40)
Explain why the rate of inflation does not change in the long run as a result of a price shock.
(Essay)
4.7/5 (35)
Which of the following descriptions best depicts the short-run effect of a leftward shift of the monetary policy line?
(Multiple Choice)
4.8/5 (39)
Suppose, for a certain economy, real and potential GDP are initially equal. Then government purchases permanently increase. Compared to the baseline, we would expect to see, in the medium run,
(Multiple Choice)
4.9/5 (37)
Exhibit 25-2
-According to Exhibit 25-2, which point best represents where the U.S. economy was in mid-2007?
(Multiple Choice)
4.8/5 (33)
The long-run effect of increased government purchases is that the sum of consumption, investment, and net exports will be lower than it would be in the baseline case.
(True/False)
4.9/5 (43)
Filters
- Essay(0)
- Multiple Choice(0)
- Short Answer(0)
- True False(0)
- Matching(0)