Exam 8: Short-Run Costs and Output Decisions
Exam 1: The Scope and Method of Economics241 Questions
Exam 2: The Economic Problem: Scarcity and Choice218 Questions
Exam 3: Demand, Supply, and Market Equilibrium309 Questions
Exam 4: Demand and Supply Applications173 Questions
Exam 5: Elasticity188 Questions
Exam 6: Household Behavior and Consumer Choice272 Questions
Exam 7: The Production Process: the Behavior of Profit-Maximizing Firms287 Questions
Exam 8: Short-Run Costs and Output Decisions386 Questions
Exam 9: Long-Run Costs and Output Decisions363 Questions
Exam 10: Input Demand: the Labor and Land Markets200 Questions
Exam 11: Input Demand: the Capital Market and the Investment Decision218 Questions
Exam 12: General Equilibrium and the Efficiency of Perfect Competition202 Questions
Exam 13: Monopoly and Antitrust Policy394 Questions
Exam 14: Oligopoly219 Questions
Exam 15: Monopolistic Competition235 Questions
Exam 16: Externalities, Public Goods, and Common Resources275 Questions
Exam 17: Uncertainty and Asymmetric Information134 Questions
Exam 18: Income Distribution and Poverty197 Questions
Exam 19: Public Finance: the Economics of Taxation281 Questions
Exam 20: International Trade, Comparative Advantage, and Protectionism287 Questions
Exam 21: Economic Growth in Developing Economies133 Questions
Exam 22: Critical Thinking About Research104 Questions
Select questions type
Refer to the information provided in Figure 8.10 below to answer the question(s) that follow. 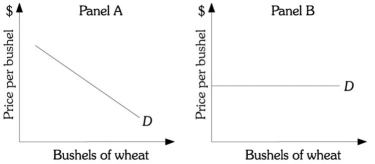
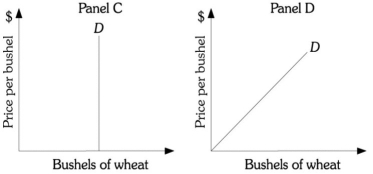 Figure 8.10
-Refer to Figure 8.10. Panel ________ represents the industry demand curve for the perfectly competitive wheat industry.
Figure 8.10
-Refer to Figure 8.10. Panel ________ represents the industry demand curve for the perfectly competitive wheat industry.
(Multiple Choice)
4.9/5  (38)
(38)
Refer to the short-run information provided in Figure 8.5 below to answer the question(s) that follow
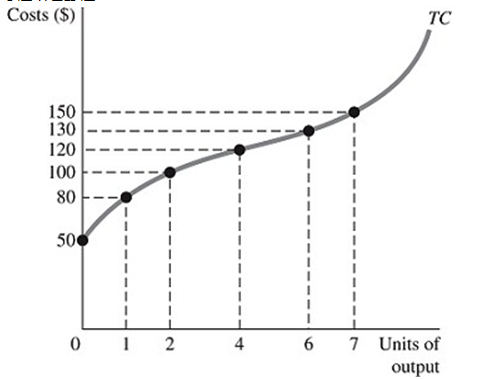 Figure 8.5
-Refer to Figure 8.5. If seven drones are produced, average fixed costs are
Figure 8.5
-Refer to Figure 8.5. If seven drones are produced, average fixed costs are
(Multiple Choice)
4.9/5 (28)
Refer to the information provided in Figure 8.9 below to answer the question(s) that follow.  Figure 8.9
-Refer to Figure 8.9. If this farmer is producing the profit-maximizing level of output, her profit is
Figure 8.9
-Refer to Figure 8.9. If this farmer is producing the profit-maximizing level of output, her profit is
(Multiple Choice)
4.8/5 (41)
If the marginal cost curve is below the average variable cost curve, then
(Multiple Choice)
4.9/5 (25)
Refer to the short-run information provided in Figure 8.5 below to answer the question(s) that follow
Figure 8.5
-Refer to Figure 8.4. Micro Oven's average fixed costs of producing two units of output are
(Multiple Choice)
4.9/5 (39)
Refer to the information provided in Table 8.1 below to answer the question(s) that follow.
Table 8.1 Produce Using Techniques Units of Variable K Inputs L 1 unit of output A 8 8 B 4 12 2 units of output A 14 12 B 8 20 3 units of output A 16 12 B 12 22
-Refer to Table 8.1. Assume that the relevant time period is the short run. Assuming the price of labor (L) is $5 per unit and the price of capital (K) is $10 per unit, the average variable cost of producing two units of output is
(Multiple Choice)
4.9/5 (44)
An individual wheat farmer produces wheat in a perfectly competitive market. A decrease in the market demand for wheat will cause the farmer's marginal revenue to ________ and his profit-maximizing level of output to ________.
(Multiple Choice)
4.9/5 (26)
A firm will begin to experience diminishing returns at the point where
(Multiple Choice)
4.8/5 (39)
If marginal cost is below average total cost, average total cost will
(Multiple Choice)
4.8/5 (19)
Refer to the information provided in Figure 8.10 below to answer the question(s) that follow. Figure 8.10
-Refer to Figure 8.10. Panel ________ represents the demand curve facing a perfectly competitive producer of wheat.
(Multiple Choice)
4.8/5 (34)
The upward-sloping portion of the perfectly competitive firm's average total cost curve is the firm's short-run supply curve.
(True/False)
4.7/5 (36)
If marginal cost equals average variable cost, average variable cost will
(Multiple Choice)
4.9/5 (33)
A dairy company, Farley Farm, has total costs of $10,000 and total variable costs of $3,000. Farley Farm's total fixed costs are
(Multiple Choice)
4.8/5 (33)
Refer to the short-run information provided in Figure 8.5 below to answer the question(s) that follow
Figure 8.5
-Refer to Figure 8.5. If two drones are produced, average fixed costs are
(Multiple Choice)
4.8/5 (30)
Refer to the information provided in Table 8.1 below to answer the question(s) that follow.
Table 8.1 Produce Using Techniques Units of Variable K Inputs L 1 unit of output A 8 8 B 4 12 2 units of output A 14 12 B 8 20 3 units of output A 16 12 B 12 22
-Refer to Table 8.1. Assuming the price of labor (L) is $5 per unit and the price of capital (K) is $10 per unit, what production technique should this firm use to produce 2 units of output?
(Multiple Choice)
4.8/5 (35)
Refer to the short-run information provided in Figure 8.5 below to answer the question(s) that follow
Figure 8.5
-Refer to Figure 8.5. If one drone is produced, average fixed costs are
(Multiple Choice)
4.8/5 (38)
Filters
- Essay(0)
- Multiple Choice(0)
- Short Answer(0)
- True False(0)
- Matching(0)