Exam 5: Elasticity
Exam 1: The Scope and Method of Economics241 Questions
Exam 2: The Economic Problem: Scarcity and Choice218 Questions
Exam 3: Demand, Supply, and Market Equilibrium309 Questions
Exam 4: Demand and Supply Applications173 Questions
Exam 5: Elasticity188 Questions
Exam 6: Household Behavior and Consumer Choice272 Questions
Exam 7: The Production Process: the Behavior of Profit-Maximizing Firms287 Questions
Exam 8: Short-Run Costs and Output Decisions386 Questions
Exam 9: Long-Run Costs and Output Decisions363 Questions
Exam 10: Input Demand: the Labor and Land Markets200 Questions
Exam 11: Input Demand: the Capital Market and the Investment Decision218 Questions
Exam 12: General Equilibrium and the Efficiency of Perfect Competition202 Questions
Exam 13: Monopoly and Antitrust Policy394 Questions
Exam 14: Oligopoly219 Questions
Exam 15: Monopolistic Competition235 Questions
Exam 16: Externalities, Public Goods, and Common Resources275 Questions
Exam 17: Uncertainty and Asymmetric Information134 Questions
Exam 18: Income Distribution and Poverty197 Questions
Exam 19: Public Finance: the Economics of Taxation281 Questions
Exam 20: International Trade, Comparative Advantage, and Protectionism287 Questions
Exam 21: Economic Growth in Developing Economies133 Questions
Exam 22: Critical Thinking About Research104 Questions
Select questions type
The income elasticity of demand for low-quality beef is -2. Thus, an 8% decrease in the quantity of low-quality beef demanded
(Multiple Choice)
4.9/5  (32)
(32)
A perfectly price elastic supply curve will be a(n) ________ line.
(Multiple Choice)
4.9/5 (31)
If a firm wants to increase revenue, it should decrease the selling price of its product if it is currently producing in the ________ portion of its demand curve.
(Multiple Choice)
4.8/5 (38)
If an increase in income results in an increase in the quantity demanded for a product, the product is ________, and the value of the income elasticity of demand is ________.
(Multiple Choice)
4.8/5 (31)
Refer to the information provided in Figure 5.7 below to answer the question(s) that follow. 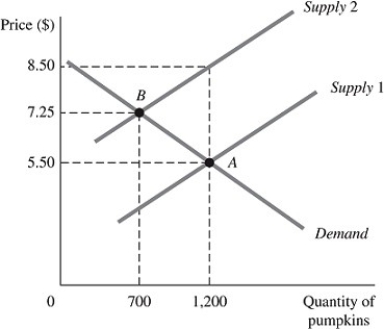 Figure 5.7
The above figure represents the market for pumpkins both before and after the imposition of an excise tax, which is represented by the shift of the supply curve.
-Refer to Figure 5.7. The amount customers will pay per pumpkin after the imposition of the tax is
Figure 5.7
The above figure represents the market for pumpkins both before and after the imposition of an excise tax, which is represented by the shift of the supply curve.
-Refer to Figure 5.7. The amount customers will pay per pumpkin after the imposition of the tax is
(Multiple Choice)
4.9/5 (40)
A tax on a good whose demand is perfectly price inelastic will be effective in discouraging consumption of that good.
(True/False)
4.8/5 (29)
Normal goods will experience decreasing demand when incomes decrease.
(True/False)
4.8/5 (31)
If the supply of oranges is unit elastic, the price elasticity of supply of oranges is
(Multiple Choice)
4.9/5 (34)
Refer to the information provided in Figure 5.7 below to answer the question(s) that follow. Figure 5.7
The above figure represents the market for pumpkins both before and after the imposition of an excise tax, which is represented by the shift of the supply curve.
-Refer to Figure 5.7. Had the demand for pumpkins been perfectly inelastic at Point A, the total revenue the government would have received from the imposition of this tax would have been
(Multiple Choice)
4.8/5 (31)
At a price of $4, quantity supplied is 120, and at a price of $10, quantity supplied is 300. Using the midpoint formula, the price elasticity of supply is ________ and supply is ________.
(Multiple Choice)
4.9/5 (33)
Point elasticity is a measure of elasticity that uses slope measurement.
(True/False)
4.9/5 (37)
On a downward-sloping linear demand curve, demand becomes more inelastic as price decreases.
(True/False)
4.7/5 (37)
When the price of coffee increases 5%, quantity demanded decreases 10%. The price elasticity of demand for coffee is ________ and total revenue from coffee sales will ________.
(Multiple Choice)
4.8/5 (37)
A perfectly price elastic demand curve will be a ________ line.
(Multiple Choice)
4.9/5 (32)
The income elasticity of demand for education is 3.5. Thus, a 6% decrease in income will
(Multiple Choice)
4.9/5 (40)
Refer to the information provided in Figure 5.2 below to answer the question(s) that follow. 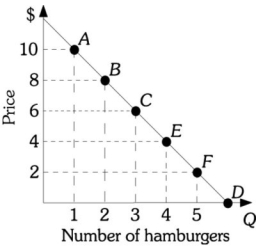 Figure 5.2
-Refer to Figure 5.2. If the price of a hamburger decreases from $6 to $4, the price elasticity of demand equals ________. Use the midpoint formula.
Figure 5.2
-Refer to Figure 5.2. If the price of a hamburger decreases from $6 to $4, the price elasticity of demand equals ________. Use the midpoint formula.
(Multiple Choice)
5.0/5 (38)
If income increases by 10% and, in response, the quantity of housing demanded increases by 7%, then the income elasticity of demand for housing is
(Multiple Choice)
4.9/5 (31)
Filters
- Essay(0)
- Multiple Choice(0)
- Short Answer(0)
- True False(0)
- Matching(0)