Exam 1: The Scope and Method of Economics
Exam 1: The Scope and Method of Economics241 Questions
Exam 2: The Economic Problem: Scarcity and Choice218 Questions
Exam 3: Demand, Supply, and Market Equilibrium309 Questions
Exam 4: Demand and Supply Applications173 Questions
Exam 5: Elasticity188 Questions
Exam 6: Household Behavior and Consumer Choice272 Questions
Exam 7: The Production Process: the Behavior of Profit-Maximizing Firms287 Questions
Exam 8: Short-Run Costs and Output Decisions386 Questions
Exam 9: Long-Run Costs and Output Decisions363 Questions
Exam 10: Input Demand: the Labor and Land Markets200 Questions
Exam 11: Input Demand: the Capital Market and the Investment Decision218 Questions
Exam 12: General Equilibrium and the Efficiency of Perfect Competition202 Questions
Exam 13: Monopoly and Antitrust Policy394 Questions
Exam 14: Oligopoly219 Questions
Exam 15: Monopolistic Competition235 Questions
Exam 16: Externalities, Public Goods, and Common Resources275 Questions
Exam 17: Uncertainty and Asymmetric Information134 Questions
Exam 18: Income Distribution and Poverty197 Questions
Exam 19: Public Finance: the Economics of Taxation281 Questions
Exam 20: International Trade, Comparative Advantage, and Protectionism287 Questions
Exam 21: Economic Growth in Developing Economies133 Questions
Exam 22: Critical Thinking About Research104 Questions
Select questions type
Isabel noted that whenever she wore her green contact lenses, the Chicago White Sox would win that evening. Based on this observation, she developed the "green-eyes-for-White-Sox" theory of winning. It is most likely true that Isabel
(Multiple Choice)
4.9/5  (35)
(35)
Refer to the information provided in Figure 1.6 below to answer the question(s) that follow. 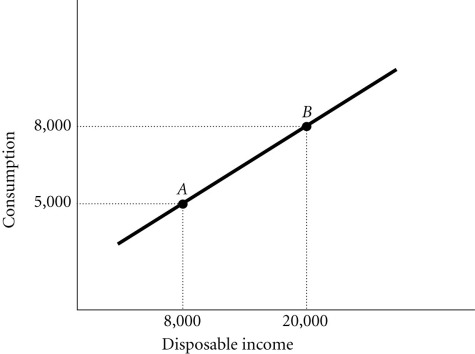 Figure 1.6
-Refer to Figure 1.6. The slope of the line between Points A and B is
Figure 1.6
-Refer to Figure 1.6. The slope of the line between Points A and B is
(Multiple Choice)
4.8/5 (37)
The rise of the modern factory system in England during the late eighteenth and early nineteenth centuries is known as the
(Multiple Choice)
4.8/5 (47)
Dividing the change in quantity on the Y-axis by the change in quantity on the X-axis calculates the slope of a line.
(True/False)
4.9/5 (36)
Refer to the information provided in Figure 1.1 below to answer the question(s) that follow. 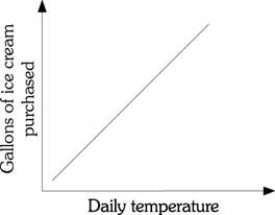 Figure 1.1
-Refer to Figure 1.1. The relationship between the daily temperature and the number of gallons of ice cream purchased demonstrates
Figure 1.1
-Refer to Figure 1.1. The relationship between the daily temperature and the number of gallons of ice cream purchased demonstrates
(Multiple Choice)
4.7/5 (31)
A measure that can change from observation to observation is known as a(n)
(Multiple Choice)
4.8/5 (36)
Positive economics questions "What ought to be?" Normative economics predicts the consequences of alternative actions, answering the questions "What is?" or "What will be?"
(True/False)
4.8/5 (41)
Refer to the information provided in Figure 1.3 below to answer the question(s) that follow. 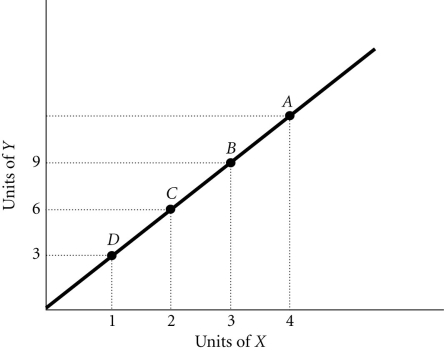 Figure 1.3
-Refer to Figure 1.3. At Point A, what is the value of Y?
Figure 1.3
-Refer to Figure 1.3. At Point A, what is the value of Y?
(Multiple Choice)
4.8/5 (42)
A graph illustrating how a variable changes over time is called a time-series graph.
(True/False)
4.8/5 (29)
If you observe that Kelly Clarkson won American Idol 3 years before Carrie Underwood won, and you conclude that Kelly Clarkson winning caused Carrie Underwood to win 3 years later, you would be guilty of an error called the
(Multiple Choice)
4.9/5 (41)
The statement "people should pollute as little as possible" is an example of a
(Multiple Choice)
4.8/5 (38)
Related to the Economics in Practice on p. 10: Prior to joining the glee club, Anjelica spent most of her free time studying in the library. Once she joined the glee club, Anjelica spent her free time hanging out in karaoke bars with other glee club members. This change in behavior is best described by
(Multiple Choice)
4.9/5 (32)
Refer to the information provided in Figure 1.7 below to answer the question(s) that follow. 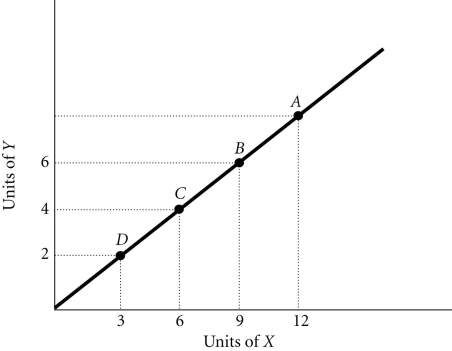 Figure 1.7
-Refer to Figure 1.7. If a 45-degree line were also graphed, it would ________ the line shown on the graph.
Figure 1.7
-Refer to Figure 1.7. If a 45-degree line were also graphed, it would ________ the line shown on the graph.
(Multiple Choice)
4.8/5 (38)
Refer to the information provided in Figure 1.7 below to answer the question(s) that follow. Figure 1.7
-Refer to Figure 1.7. The slope of the line between Points D and B is
(Multiple Choice)
4.8/5 (34)
Refer to the information provided in Figure 1.4 below to answer the question(s) that follow. 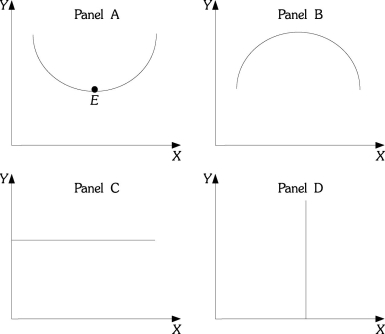 Figure 1.4
-Refer to Figure 1.4. Panel B shows a curve which has a slope that is
Figure 1.4
-Refer to Figure 1.4. Panel B shows a curve which has a slope that is
(Multiple Choice)
4.8/5 (43)
Refer to the information provided in Figure 1.7 below to answer the question(s) that follow. Figure 1.7
-Refer to Figure 1.7. The slope of the line is
(Multiple Choice)
5.0/5 (35)
Filters
- Essay(0)
- Multiple Choice(0)
- Short Answer(0)
- True False(0)
- Matching(0)