Exam 34: Inflation, Deflation, and Macro Policy
Exam 1: Economics and Economic Reasoning158 Questions
Exam 2: The Production Possibility Model, Trade, and Globalization133 Questions
Exam 3: Economic Institutions163 Questions
Exam 4: Supply and Demand182 Questions
Exam 5: Using Supply and Demand163 Questions
Exam 6: Describing Supply and Demand: Elasticities216 Questions
Exam 7: Taxation and Government Intervention201 Questions
Exam 8: Market Failure Versus Government Failure197 Questions
Exam 9: Comparative Advantage, Exchange Rates, and Globalization118 Questions
Exam 10: International Trade Policy99 Questions
Exam 11: Production and Cost Analysis I194 Questions
Exam 12: Production and Cost Analysis II152 Questions
Exam 13: Perfect Competition170 Questions
Exam 14: Monopoly and Monopolistic Competition274 Questions
Exam 15: Oligopoly and Antitrust Policy142 Questions
Exam 16: Real-World Competition and Technology108 Questions
Exam 17: Work and the Labor Market150 Questions
Exam 18: Who Gets What the Distribution of Income131 Questions
Exam 19: The Logic of Individual Choice: the Foundation of Supply and Demand170 Questions
Exam 20: Game Theory, Strategic Decision Making, and Behavioral Economics103 Questions
Exam 21: Thinking Like a Modern Economist97 Questions
Exam 22: Behavioral Economics and Modern Economic Policy126 Questions
Exam 23: Microeconomic Policy, Economic Reasoning, and Beyond134 Questions
Exam 24: Economic Growth, Business Cycles, and Unemployment124 Questions
Exam 25: Measuring and Describing the Aggregate Economy229 Questions
Exam 26: The Keynesian Short-Run Policy Model: Demand-Side Policies220 Questions
Exam 27: The Classical Long-Run Policy Model: Growth and Supply-Side Policies133 Questions
Exam 28: The Financial Sector and the Economy214 Questions
Exam 29: Monetary Policy243 Questions
Exam 30: Financial Crises, Panics, and Unconventional Monetary Policy109 Questions
Exam 31: Deficits and Debt: the Austerity Debate150 Questions
Exam 32: The Fiscal Policy Dilemma119 Questions
Exam 33: Jobs and Unemployment78 Questions
Exam 34: Inflation, Deflation, and Macro Policy175 Questions
Exam 35: International Financial Policy211 Questions
Exam 36: Macro Policy in a Global Setting134 Questions
Exam 37: Structural Stagnation and Globalization125 Questions
Exam 38: Macro Policy in Developing Countries142 Questions
Select questions type
According to the text, if individuals base their expectations on the past, we could say that their expectations are:
(Multiple Choice)
4.9/5  (36)
(36)
Economists who believe in the quantity theory favor monetary policy set by rules.Why?
(Essay)
4.8/5 (41)
The short-run Phillips curve differs from the long-run Phillips curve with regard to the way:
(Multiple Choice)
4.8/5 (36)
Assume the money supply is $1000,the velocity of money is 12,and the price level is $4.Using the quantity theory of money:
(a)Determine the level of real output.
(b)Determine the level of nominal output.
(c)Assuming velocity remains constant,what will happen if the money supply rises by 10%?
(Essay)
4.9/5 (42)
Use a Phillips curve diagram to explain the difference between the macroeconomic policy positions of the quantity theorists and the institutionalists.
(Essay)
4.9/5 (40)
Refer to the graph shown. The relationship represented in the figure is called a: 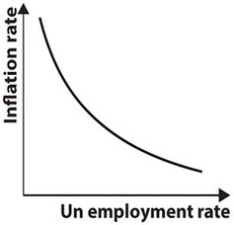
(Multiple Choice)
4.8/5 (36)
How would institutionally focused economist's explanation of the inflation process likely differ from a quantity theorist's explanation?
(Essay)
4.8/5 (39)
According to the quantity theory of money, if the monetary authorities allow the money supply to grow at a rate of 6 percent in an economy that is growing by 2 percent in real terms, then inflation will be:
(Multiple Choice)
4.8/5 (35)
The long-run Phillips curve shifts to the left or the right as expectations of inflation change.
(True/False)
4.8/5 (42)
Refer to the graph shown. The shift in the short-run Phillips curve shown is most likely to be caused by: 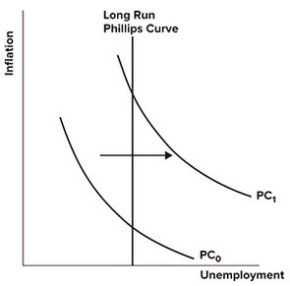
(Multiple Choice)
4.8/5 (36)
If global prices are lower than domestic prices, the short-run Phillips curve is likely to be horizontal.
(True/False)
4.8/5 (41)
It's difficult to measure asset inflation because asset prices can increase when assets become more productive.
(True/False)
5.0/5 (34)
The quantity theory of money concludes that if real output is constant:
(Multiple Choice)
4.9/5 (41)
Draw a short run and long-run Phillips curve.Why is the shape of the short-run Phillips curve different from the shape of the long-run Phillips curve?
(Essay)
4.9/5 (35)
The short-run Phillips curve tells us, in theory, what combinations of:
(Multiple Choice)
4.9/5 (40)
Filters
- Essay(0)
- Multiple Choice(0)
- Short Answer(0)
- True False(0)
- Matching(0)