Exam 5: Using Supply and Demand
Exam 1: Economics and Economic Reasoning158 Questions
Exam 2: The Production Possibility Model, Trade, and Globalization133 Questions
Exam 3: Economic Institutions163 Questions
Exam 4: Supply and Demand182 Questions
Exam 5: Using Supply and Demand163 Questions
Exam 6: Describing Supply and Demand: Elasticities216 Questions
Exam 7: Taxation and Government Intervention201 Questions
Exam 8: Market Failure Versus Government Failure197 Questions
Exam 9: Comparative Advantage, Exchange Rates, and Globalization118 Questions
Exam 10: International Trade Policy99 Questions
Exam 11: Production and Cost Analysis I194 Questions
Exam 12: Production and Cost Analysis II152 Questions
Exam 13: Perfect Competition170 Questions
Exam 14: Monopoly and Monopolistic Competition274 Questions
Exam 15: Oligopoly and Antitrust Policy142 Questions
Exam 16: Real-World Competition and Technology108 Questions
Exam 17: Work and the Labor Market150 Questions
Exam 18: Who Gets What the Distribution of Income131 Questions
Exam 19: The Logic of Individual Choice: the Foundation of Supply and Demand170 Questions
Exam 20: Game Theory, Strategic Decision Making, and Behavioral Economics103 Questions
Exam 21: Thinking Like a Modern Economist97 Questions
Exam 22: Behavioral Economics and Modern Economic Policy126 Questions
Exam 23: Microeconomic Policy, Economic Reasoning, and Beyond134 Questions
Exam 24: Economic Growth, Business Cycles, and Unemployment124 Questions
Exam 25: Measuring and Describing the Aggregate Economy229 Questions
Exam 26: The Keynesian Short-Run Policy Model: Demand-Side Policies220 Questions
Exam 27: The Classical Long-Run Policy Model: Growth and Supply-Side Policies133 Questions
Exam 28: The Financial Sector and the Economy214 Questions
Exam 29: Monetary Policy243 Questions
Exam 30: Financial Crises, Panics, and Unconventional Monetary Policy109 Questions
Exam 31: Deficits and Debt: the Austerity Debate150 Questions
Exam 32: The Fiscal Policy Dilemma119 Questions
Exam 33: Jobs and Unemployment78 Questions
Exam 34: Inflation, Deflation, and Macro Policy175 Questions
Exam 35: International Financial Policy211 Questions
Exam 36: Macro Policy in a Global Setting134 Questions
Exam 37: Structural Stagnation and Globalization125 Questions
Exam 38: Macro Policy in Developing Countries142 Questions
Select questions type
New York City has been experiencing a housing emergency for quite some time. Apartments are difficult to come by. In fact, the vacancy rate has been below 5 percent since World War II. The most likely cause of the housing emergency is:
(Multiple Choice)
4.7/5  (34)
(34)
Refer to the following graph. 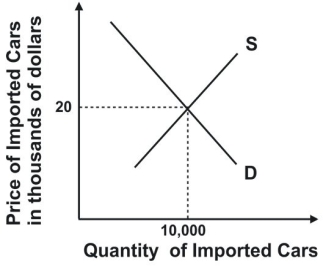 Suppose the graph depicted market demand for British cars sold in the United States. A tariff of $1,000 a car would result in tax revenue of:
(Multiple Choice)
4.9/5 (39)
Refer to the graph shown that depicts a third-party payer market for prescription drugs. What happens to expenditures by consumers in this market if a $2 co-pay is established compared to a free-market equilibrium? 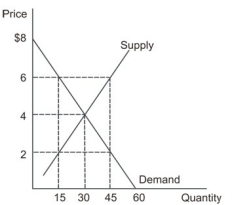
(Multiple Choice)
4.9/5 (35)
What is an excise tax? Demonstrate the effect of an excise tax paid by suppliers on equilibrium quantity and price.
(Essay)
4.9/5 (40)
Suppose that initially, supply is given by the equation Qs = 4P − 16. If, as a result of lower production costs, the quantity supplied increases by 4 at every price, the new supply equation would be:
(Multiple Choice)
4.9/5 (34)
Refer to the graph shown. Given the quantity restriction of QR, a reduction in demand will: 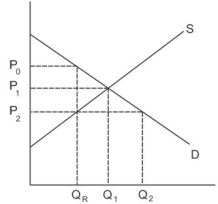
(Multiple Choice)
4.7/5 (33)
Refer to the following graph. 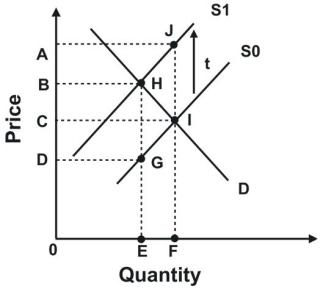 If this graph represents the supply of and demand for an imported product, a tariff of t will result in revenue for the government shown by area:
(Multiple Choice)
4.8/5 (39)
If the government imposes an excise tax on cars equal to $5,000 per automobile, the supply of automobiles will shift to the:
(Multiple Choice)
5.0/5 (30)
Refer to the graph shown. Without government intervention, market forces would result in: 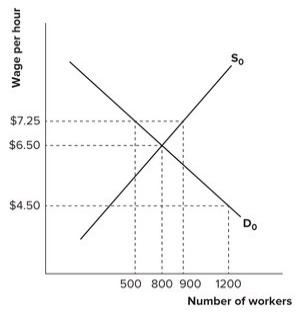
(Multiple Choice)
4.8/5 (32)
Refer to the graph shown. Which of the following wage rates would be an effective price floor? 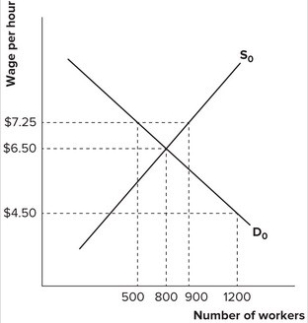
(Multiple Choice)
4.9/5 (31)
Refer to the graph shown. A quantity restriction of QR will: 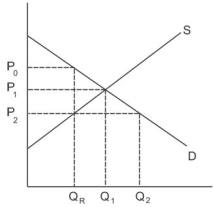
(Multiple Choice)
4.8/5 (38)
A price floor causes excess demand, resulting in the need to ration by some means other than price.
(True/False)
4.9/5 (38)
Refer to the table shown that depicts a third-party payer market. What is the quantity demanded if a $1 co-pay is established? Price Quantity Demanded Quantity Supplied \ 0 1,200 0 \ 1 600 150 \ 2 300 300 \ 3 0 450 \ 4 0 600 \ 5 0 750 \ 6 0 900 \ 7 0 1,050
(Multiple Choice)
4.8/5 (37)
Refer to the graph shown. If government establishes a price floor of $7.25 per hour, there will be a: 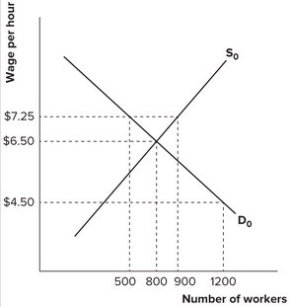
(Multiple Choice)
4.8/5 (34)
Demonstrate graphically and explain verbally the impact of a third-party payer market on supply and demand equilibrium in this case.Be sure to discuss equilibrium quantity,price received by suppliers,price paid by consumers,and total expenditures.
(Essay)
4.9/5 (42)
How does total size of expenditures in a third-part payer market compare to the total size of expenditures in a market with no third-party payer?
(Essay)
4.8/5 (28)
Suppose that initially, the equations for demand and supply are Qd = 48 − 4P and Qs = 4P − 16, respectively. If the quantity demanded increases by 12 at every price (so that the demand curve shifts to the right), the equilibrium price will change from:
(Multiple Choice)
4.8/5 (30)
An increase in the Federal minimum wage, assuming the minimum is higher than equilibrium wage and that all other things remain constant, will:
(Multiple Choice)
4.9/5 (37)
Filters
- Essay(0)
- Multiple Choice(0)
- Short Answer(0)
- True False(0)
- Matching(0)