Exam 10: Describing Relationships Using Correlation and Regression
Exam 1: Introduction to Statistics and Research50 Questions
Exam 2: Creating and Using Frequency Distributions55 Questions
Exam 3: Summarizing Scores With Measures of Central Tendency60 Questions
Exam 4: Summarizing Scores With Measures of Variability58 Questions
Exam 5: Describing Data With Z-Scores and the Normal Curve53 Questions
Exam 6: Using Probability to Make Decisions About Data54 Questions
Exam 7: Overview of Statistical Hypothesis Testing: the Z-Test49 Questions
Exam 8: Hypothesis Testing Using the One-Sample T-Test44 Questions
Exam 9: Hypothesis Testing Using the Two-Sample T-Test49 Questions
Exam 10: Describing Relationships Using Correlation and Regression40 Questions
Exam 11: Hypothesis Testing Using the One-Way Analysis of Variance34 Questions
Exam 12: Understanding the Two-Way Analysis of Variance34 Questions
Exam 13: Chi Square and Nonparametric Procedures35 Questions
Select questions type
Use the following data set and conduct a one-tailed test of significance in the upper tail on the Pearson r.Use =
.05.
a.What are your null and alternative hypotheses?
b.What are your degrees of freedom?
c.What is the critical value?
d.Calculate the Pearson r
e.What do you conclude? 
(Essay)
4.7/5  (29)
(29)
If you have a Pearson correlation coefficient of .30, what is the proportion of variance accounted for?
(Multiple Choice)
4.9/5 (30)
Use the following data set and conduct a two-tailed test of significance on the Pearson r.Use = .05.
a.What are your null and alternative hypotheses?
b.What are your degrees of freedom?
c.What is the critical value?
d.Calculate the Pearson r
e.What do you conclude? Study A X Y 2 8 5 4 8 2 4 5 5 4 6 5 1 9 6 5 3 6
(Essay)
4.7/5 (33)
Suppose you've done a study and you're writing up your results for presentation in an APA journal.You want to report a significant correlation of -.72 with degrees of freedom of 51.How would you report this?
(Short Answer)
4.9/5 (26)
The best-fitting line through a scatterplot is known as the
(Multiple Choice)
4.8/5 (35)
We should do a scatterplot of the data when we compute a correlation because the scatterplot allows us to
(Multiple Choice)
4.9/5 (35)
What type of relationship does the following regression line represent? 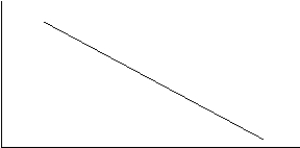
(Short Answer)
4.8/5 (39)
When plotting correlational data, the appropriate graph to use is the
(Multiple Choice)
4.7/5 (30)
Use the following data set and conduct a two-tailed test of significance on the Pearson r.Use = .05.
a.What are your null and alternative hypotheses?
b.What are your degrees of freedom?
c.What is the critical value?
d.Calculate the Pearson r
e.What do you conclude? 
(Essay)
4.7/5 (29)
Professor Miller has found the correlation between a person's "need for affiliation" found by taking a test to determine the need to be with others) and the number of hours spent watching television is −0.69.He should conclude
(Multiple Choice)
4.9/5 (23)
What type of relationship does the following regression line represent? 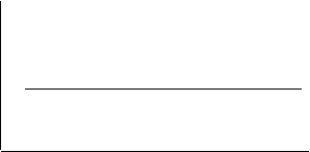
(Short Answer)
4.9/5 (37)
Suppose you've calculated a Pearson correlation coefficient and had a final value of +10.How do you interpret this result?
(Essay)
4.9/5 (32)
When the correlation coefficient representing the relationship between X and Y is intermediate, then all of the following are true except
(Multiple Choice)
4.9/5 (34)
Filters
- Essay(0)
- Multiple Choice(0)
- Short Answer(0)
- True False(0)
- Matching(0)