Exam 3: Summarizing Scores With Measures of Central Tendency
Exam 1: Introduction to Statistics and Research50 Questions
Exam 2: Creating and Using Frequency Distributions55 Questions
Exam 3: Summarizing Scores With Measures of Central Tendency60 Questions
Exam 4: Summarizing Scores With Measures of Variability58 Questions
Exam 5: Describing Data With Z-Scores and the Normal Curve53 Questions
Exam 6: Using Probability to Make Decisions About Data54 Questions
Exam 7: Overview of Statistical Hypothesis Testing: the Z-Test49 Questions
Exam 8: Hypothesis Testing Using the One-Sample T-Test44 Questions
Exam 9: Hypothesis Testing Using the Two-Sample T-Test49 Questions
Exam 10: Describing Relationships Using Correlation and Regression40 Questions
Exam 11: Hypothesis Testing Using the One-Way Analysis of Variance34 Questions
Exam 12: Understanding the Two-Way Analysis of Variance34 Questions
Exam 13: Chi Square and Nonparametric Procedures35 Questions
Select questions type
During the past six baseball games he played, Jimmy got 3, 2, 0, 1, 1, and 3 hits.What is his ΣX?
(Short Answer)
4.8/5  (34)
(34)
Based on the following results of an experiment, how many errors would a person who drank 4 oz.of alcohol make?
Mean Number of Errors on Driving Test 
(Short Answer)
4.8/5 (37)
Find the mode of the following data set.
8, 7, 2, 4, 4, 8, 2, 4, 6, 5, 7, 3, 9, 4, 5, 4, 7
(Short Answer)
4.8/5 (32)
Error refers to expected errors in predicting unknown scores and is represented by
(Multiple Choice)
4.9/5 (39)
In order to decide which measure of central tendency is appropriate, you must first determine
(Multiple Choice)
4.9/5 (41)
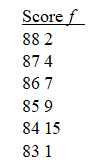
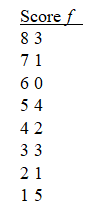
For the following data set, find the mode, median, and the mean.What shape do these measures of centrality suggest for the data?
(Essay)
4.8/5 (40)
Find the mode of each of the following two data sets.
Set A: 35, 14, 30, 22, 19, 43, 35, 24, 27, 30, 32, 41, 20, 21, 30, 25, 20, 19, 18, 28
Set B: 35, 14, 30, 22, 19, 43, 35, 24, 27, 30, 32, 41, 209, 21, 30, 25, 20, 19, 18, 28
Does the extreme score 209) impact the mode? Explain.
(Short Answer)
5.0/5 (24)
The mean tends to be lower than the median for ________distributions).
(Multiple Choice)
4.7/5 (38)
Frank earned an exam score that equaled the class mean.Can we determine his deviation score without actual values? Explain.
(Essay)
4.7/5 (34)
With respect to other scores in a distribution, measures of central tendency
(Multiple Choice)
4.8/5 (38)
What shape would you say best describes the following set of scores?
2, 2, 3, 3, 3, 3, 4, 4, 5, 6, 7, 7, 8, 8, 8, 8, 9, 9
(Short Answer)
5.0/5 (35)
Five students took a personality test.Their deviation scores were -4, +3, +1, -2, and +2.Assuming that these scores
form a normal distribution, which deviation represents the highest raw score?
(Short Answer)
4.7/5 (41)
Adding numbers is an important procedure in statistics.Instead of saying "add up all of the scores," we use the symbol
(Multiple Choice)
4.7/5 (29)
If you're interested in knowing the income for a given locality in the United States, what is probably the preferred measure of central tendency and why?
(Essay)
4.7/5 (34)
With respect to a graph of a frequency distribution, a positive deviation score
(Multiple Choice)
4.8/5 (36)
Does the following graph indicate the existence of a relationship? Explain your answer.
Mean Number of Errors on Driving Test 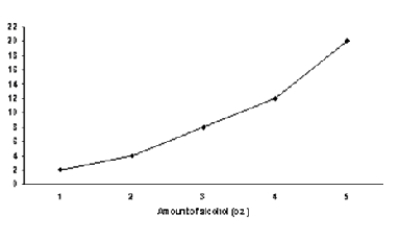
(Essay)
4.8/5 (34)
Find the deviation from the mean for each value in the following distribution.
(Essay)
4.8/5 (30)
Filters
- Essay(0)
- Multiple Choice(0)
- Short Answer(0)
- True False(0)
- Matching(0)