Exam 3: Summarizing Scores With Measures of Central Tendency
Exam 1: Introduction to Statistics and Research50 Questions
Exam 2: Creating and Using Frequency Distributions55 Questions
Exam 3: Summarizing Scores With Measures of Central Tendency60 Questions
Exam 4: Summarizing Scores With Measures of Variability58 Questions
Exam 5: Describing Data With Z-Scores and the Normal Curve53 Questions
Exam 6: Using Probability to Make Decisions About Data54 Questions
Exam 7: Overview of Statistical Hypothesis Testing: the Z-Test49 Questions
Exam 8: Hypothesis Testing Using the One-Sample T-Test44 Questions
Exam 9: Hypothesis Testing Using the Two-Sample T-Test49 Questions
Exam 10: Describing Relationships Using Correlation and Regression40 Questions
Exam 11: Hypothesis Testing Using the One-Way Analysis of Variance34 Questions
Exam 12: Understanding the Two-Way Analysis of Variance34 Questions
Exam 13: Chi Square and Nonparametric Procedures35 Questions
Select questions type
For the following order of the measures of centrality, draw the shape that best describes the associated distribution. 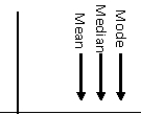
(Essay)
4.7/5  (28)
(28)
Find the mode of the scores in the following frequency distribution. 
(Short Answer)
4.8/5 (41)
For the following data set, find the mode, median, and the mean.What shape do these measures of centrality suggest for the data?
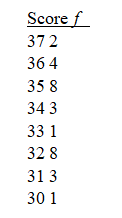
(Essay)
4.8/5 (24)
The equipment failed to record the reaction time for one trial in an experiment.The reaction times in milliseconds) for the other trials were 505, 630, 490, 650, and 560.What is the best estimate for the missing value?
(Short Answer)
4.7/5 (31)
For the following set of scores, what is are) ?
7, 8, 10, 10, 11, 12, 13, 13, 15
(Short Answer)
4.9/5 (38)
Does the following graph indicate the existence of a relationship? Explain your answer. 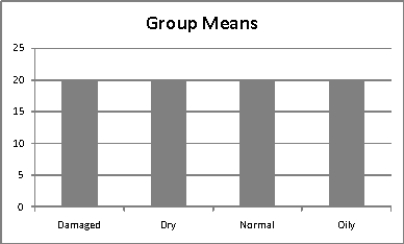
(Essay)
4.7/5 (27)
What is the mean for the following set of scores: 19, 1, 1, 2, 2?
(Multiple Choice)
4.7/5 (39)
Find the mean of the following data set.
8, 7, 2, 4, 4, 8, 2, 4, 6, 5, 7, 3, 9, 4, 5, 4, 7
(Short Answer)
4.8/5 (41)
Suppose a given researcher has established that for a particular measure of introversion, μ = 25.You've administered this same measure of introversion to a group of 125 subjects and have found a sample mean of 20.What do these two values tell us in the context of this example), and is it at all concerning that the two values are not identical?
(Essay)
4.7/5 (38)
Find the median of the following data set.
8, 7, 2, 4, 4, 8, 2, 4, 6, 5, 7, 3, 9, 4, 5, 4, 7
(Short Answer)
4.8/5 (32)
Five students took a personality test.Their deviation scores were -4, +3, +1, -2, +2.Assuming that these scores
form a normal distribution, which scores) would have the highest frequency?
(Short Answer)
4.9/5 (30)
Suppose you received a 95 on an exam where the mean score was 83.What is your score's deviation?
(Multiple Choice)
4.8/5 (30)
When the mean is used to predict scores, a deviation indicates
(Multiple Choice)
4.8/5 (37)
Filters
- Essay(0)
- Multiple Choice(0)
- Short Answer(0)
- True False(0)
- Matching(0)