Exam 2: Creating and Using Frequency Distributions
Exam 1: Introduction to Statistics and Research50 Questions
Exam 2: Creating and Using Frequency Distributions55 Questions
Exam 3: Summarizing Scores With Measures of Central Tendency60 Questions
Exam 4: Summarizing Scores With Measures of Variability58 Questions
Exam 5: Describing Data With Z-Scores and the Normal Curve53 Questions
Exam 6: Using Probability to Make Decisions About Data54 Questions
Exam 7: Overview of Statistical Hypothesis Testing: the Z-Test49 Questions
Exam 8: Hypothesis Testing Using the One-Sample T-Test44 Questions
Exam 9: Hypothesis Testing Using the Two-Sample T-Test49 Questions
Exam 10: Describing Relationships Using Correlation and Regression40 Questions
Exam 11: Hypothesis Testing Using the One-Way Analysis of Variance34 Questions
Exam 12: Understanding the Two-Way Analysis of Variance34 Questions
Exam 13: Chi Square and Nonparametric Procedures35 Questions
Select questions type
If the number of hot lunches sold at school this week was 1,350 and the relative frequency on Friday was 0.22, how many lunches were sold on Friday?
(Short Answer)
4.9/5  (30)
(30)
In the following frequency distribution, the score of 5 would have a percent of .
(Short Answer)
4.8/5 (31)
For the following data set, generate the frequency distribution table.Provide columns for frequency, relative frequency, and percent.
8, 8, 7, 7, 6, 6, 6, 6, 6, 6, 5, 5, 5, 5, 5, 4, 4, 4, 3, 3, 2
(Essay)
4.8/5 (25)
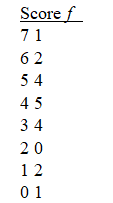
What is the most frequently occurring score in the following frequency distribution? 
(Multiple Choice)
4.8/5 (28)
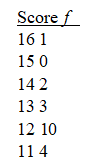
Using the frequency distribution below, what is the total frequency of the scores 6 and 7? 
(Multiple Choice)
4.9/5 (34)
For the following data set, identify the shape of the distribution.
8, 8, 7, 7, 6, 6, 6, 6, 6, 6, 6, 6, 5, 5, 5, 4, 4, 4, 3, 3, 2
(Short Answer)
4.8/5 (32)
Suppose you scored a 72 on a given test as did 11 other individuals.While no one scored below you, 23 other people scored above you.What is the cumulative frequency for your score?
(Essay)
4.8/5 (41)
The distinguishing characteristic of the frequency polygon is
(Multiple Choice)
4.8/5 (47)
In a data set with 25 scores, if the value 16 occurs 12 times, what is its relative frequency?
(Short Answer)
5.0/5 (34)
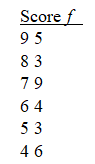
What is the relative frequency for the score of 12 in the following frequency distribution?
(Short Answer)
4.8/5 (37)
In a normal curve, the proportion of the area under the curve between two scores represents
(Multiple Choice)
4.8/5 (29)
For the following frequencies, what are the correct relative frequencies?
(Essay)
5.0/5 (46)
Which graphing techniques are appropriate for interval and ratio data?
(Multiple Choice)
4.9/5 (34)
A distribution that is not a perfectly shaped normal distribution should be labeled as a/an
(Multiple Choice)
4.9/5 (32)
In a normal distribution with a mean of 30, what percentage of the scores would be above the mean?
(Multiple Choice)
4.9/5 (28)
Filters
- Essay(0)
- Multiple Choice(0)
- Short Answer(0)
- True False(0)
- Matching(0)