Exam 2: Continuous Data- Making Comparisons
An investigator wants to compare mean HbA1c levels among three groups.
a. Suppose that the three groups being compared involve a control and two experimental therapies. The purpose of the study is exploratory to see if the therapies impact HbA1c. The investigator uses the Bonferroni adjustment to reduce the chance of making a type 1 error. Is this appropriate? What are the implications of making the adjustment?
b. Suppose that the study is an observational one and is the first investigation of differences in HbA1c for these three groups. The purpose of the study is exploratory to see if a clinical trial investigating these three groups is warranted. Without adjusting for multiple comparisons, the investigator finds that there is a difference between groups 1 and 2, but after adjusting for multiple comparisons, the p-value is no longer significant. Advise the investigator.
c. Suppose that the study is a confirmatory clinical trial to investigate the impact of a no-treatment control, an active control, and a treatment on HbA1c. When making comparisons among the three groups, the investigator decides to implement an adjustment to protect against making a type 1 error. Is this appropriate? What are the implications of making the adjustment?
a. Performing a Bonferroni adjustment would reduce the chance of making a type 1 error, but since the purpose of the study is exploratory, a multiple comparison adjustment may not be necessary. There are only three groups and a Bonferroni adjustment may inflate the type 2 error (a more serious error in this case).
b. If the investigator is only interested in understanding the differences between groups 1 and 2, I would advise the investigator to only focus on those two groups. If the investigator just focuses on groups 1 and 2, then a multiple comparison adjustment will not need to be made.
c. A multiple comparison adjustment may be appropriate. In confirmatory trials, type 1 errors tend to be more serious than type 2 errors. For this reason, adjustment for multiple comparisons would be justified.
The size of an infant's thyroid can predict the health of that infant. A journal article has been submitted describing a study where the researchers wanted to see if there were differences in thyroid volume size between infants born prematurely and those born full term. You have been asked to review the journal article and find the statement, "Thyroid volume was found to be skewed, so we employed a nonparametric test to investigate the following hypothesis: H0: µ1 - µ2 = 0 vs. H1: µ1 - µ2  0; the mean differences between the two groups are not different versus they are different." Critique the statement.
I agree with the researcher because thyroid volume is skewed (no symmetric distribution) and a nonparametric test should be employed. What is not correct in his statement is the hypothesis statement. With skewed data, means are not appropriate. The hypotheses should refer to differences in thyroid volume distribution for the two groups and not the mean differences.
An investigator wants to compare the mean ages between mothers who have and do not have a history of substance abuse. Histograms for the two groups are given below. Based on these figures, would it be reasonable to perform a two-sample t-test with equal variances? Why or why not?
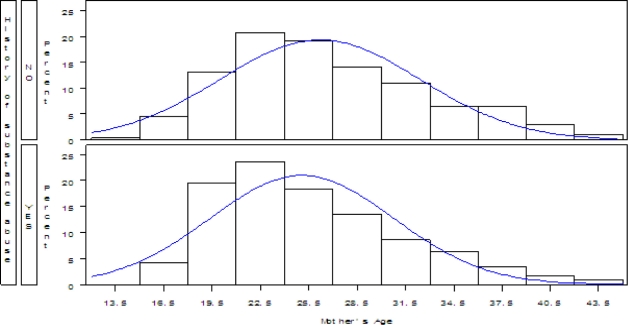
Based on the figure, it would be reasonable to conduct a two-sample t-test with equal variances. Looking at the distribution of the two groups, the tails and spreads of both histograms look similar. So it would be reasonable to assume the variances are equal and conduct the t-test.
You are interested in whether the infants in your unit differ in birth weight by sex (male and female). You present your results in a box plot provided below:
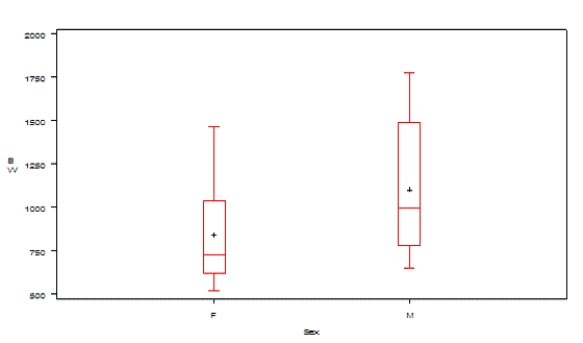 What information can you obtain from this plot?
You have decided to conduct a study where you are interested in observing mean differences in blood lead levels (mg/dL) in individuals who drink well water versus those who drink tap water. A previous study reported an effect size of 0.10, and you use this in planning your study. This effect size is considered small, what impact will a small effect size have on sample size planning? Explain.
A group of individuals were selected to participate in a diet program. Waist circumferences were collected before and after the program. The question of interest was whether there was a mean change in circumference due to the diet program. A mean change of 2 inches is considered clinically meaningful.
A)The researcher found a mean change of 2.2 inches and wants to conclude that the diet works. Can the researcher make this conclusion? Why or why not? B)Suppose a 95% confidence interval for the mean change was calculated (-1.75, 3.00). Explain to the researcher what this means.
The investigator has two options for designing a study. One option is a single-group design where the subjects are measured before and after the intervention. Another option is a two-group design where one group receives the intervention and the other does not. Compare and contrast these two designs. Provide an example for when each would be appropriate.
Suppose that the overall F-test obtained from performing a one-way ANOVA resulted in a p-value that was not statistically significant. Which of the following CANNOT be true?
An investigator is considering a study for assessing the change in viral loads among those individuals who are on drug treatments versus those who are not. Two sample sizes were proposed (300 and 600). If the investigator chooses the larger sample size, what will happen to the precision (width) of the interval estimate?
A researcher is preparing a grant that will focus on comparing mother's history of drug abuse (history vs. no history) and infant birth weight. The grant proposal requires a sample size calculation for testing the difference between the two groups. In order to calculate the sample size, the researcher needs the following three items:
You have measured the blood lead levels (mg/dL) of a random sample of 30 children living in an urban area. A 90% confidence interval for the mean blood lead levels for the children is computed to be (10.1, 35.8). Provide a valid interpretation of this interval.
An investigator collected HbA1c levels on a sample of 10 patients who are suspected to be at risk for diabetes. The values for the 10 patients are 2, 2, 2, 4, 4, 6, 7, 7, 9, and 9. The mean level was 5.2 with a standard deviation of 2.78. The median was 5 with an interquartile range of 2 and 7. The investigator adds two more patients with values 1 and 12. Explain what will happen to the center and spread of this distribution.
A study was conducted to investigate biomarker levels associated with cartilage damage in a population of healthy athletes.a.You suggest that a histogram be created. Explain to your colleagues what information a histogram provides and why it would be helpful.b.As an additional aim of the study, the primary investigator would like to compare biomarker levels based on severity of injuries experienced (none, moderate, severe). Explain to your colleagues what information box-and-whisker plots provide and why they would be helpful.
You have conducted a study where you were interested in the amount of menthol cigarette consumption (cigarettes per day) among black females. Your results suggested that the average number of menthol cigarettes consumed per day was 3.0. The national average number of menthol cigarettes smoked per day for females was 2.5. Assuming normality, you conducted a one-sample t-test to test H0: µ = 2.5 versus µ >2.5. You get a p-value of 0.08. Interpret the results.
A group of researchers conducted a study to see if intravenous drug users (IDUs) have lower CD4+ cell counts at initiation of antiretroviral therapy compared to non-IDUs. CD4+ cell counts are known to have skewed distributions. Provide the appropriate statistical test along with the corresponding null and research hypotheses for investigating differences in CD4+ cell counts between the two groups.
You are given a large data set that includes patients from six major hospitals. You are interested in estrogen levels among the women in the data set. You find that most of the measurements are similar, but a few are rather large. If you plotted a histogram, what shape would it take on? How would the mean and median compare?
An investigator has conducted a study where it is hypothesized that exposing premature babies to small amounts of caffeine within 24 hours of birth will decrease their length of hospital stay. The sample size for the study was 80. The mean length of stay for the infants given caffeine was 40 (SD=12) days. The literature reports that premature infants given noncaffeine stimulants within 24 hours had a mean length of stay of 46 (SD=13) days.
A)Does caffeine do a better job at reducing the length of stay? Support your answer with statistical evidence.
B)After additional investigation, the investigator realizes that the distribution of length of stay is skewed. How does that impact the findings in (a)? What advice would you give the investigator for answering the question of whether caffeine does a better job at reducing the length of stay?
An investigator conducted an ANOVA where he was interested in group (three) differences in mean blood pressure levels. The results are given in the table below
 What can the investigator conclude?
A researcher conducted a study to see if there are differences in mean prostate-specific antigen (PSA) levels between men aged >50 years (μ1) and men aged  50 years (μ2). The researcher hypothesizes that there will be a difference in mean PSA between the two groups. We are assuming that PSA levels have a symmetric distribution. The 95% confidence interval for the difference in mean PSA between age groups was (0.2, 6.0). What can you conclude from this confidence interval?
Filters
- Essay(0)
- Multiple Choice(0)
- Short Answer(0)
- True False(0)
- Matching(0)