Exam 3: Continuous Data: Correlation and Regression
Exam 1: An Overview of Statistical Concepts20 Questions
Exam 2: Continuous Data- Making Comparisons20 Questions
Exam 3: Continuous Data: Correlation and Regression20 Questions
Exam 4: Categorical Data: Comparisons and Associations20 Questions
Exam 5: A Dichotomous Outcome: Confounding and Regression23 Questions
Exam 6: Count Data20 Questions
Exam 7: Time to Event Data20 Questions
Select questions type
A researcher needs your help in identifying the best statistical method for a research study. The researcher believes that blue-collar workers have higher cholesterol levels compared to service and white-collar workers. High levels of cholesterol can lead to heart disease and stroke. The researcher hypothesizes that controlling for race, age, and income, blue-collar workers will have higher mean cholesterol levels compared to the other two groups. Which of the following is the appropriate method to employ?
Free
(Multiple Choice)
4.9/5  (36)
(36)
Correct Answer: Verified
A
A colleague was asked to present his results with 95% confidence intervals instead of using a p-value, but he does not know how to interpret confidence intervals. He conducted a simple linear regression to assess the relationship between body mass index (BMI) and number of cigarettes smoked per day. Your colleague gives you the following information: parameter estimate is 0.10 with a 95% confidence interval of 0.001 to 0.30. Provide an interpretation to your colleague.
Free
(Essay)
4.8/5 (29)
Correct Answer:Verified
As you increase the number of cigarettes smoked per day by 1 unit, BMI will increase by 0.10 units. A 95% confidence interval provides a set of plausible values for the real slope. The 95% confidence interval does not contain 0, so we are 95% confident that the slope is not zero. More importantly, because the interval estimates suggest that the slope is greater than 0, there is a positive association.
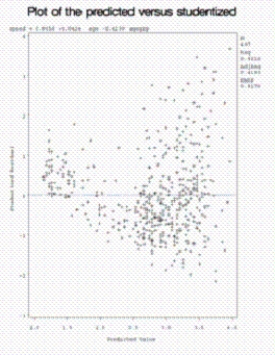
Observe the following residual plot. Determine if any of the assumptions are violated. If a violation has occurred, state it and propose a fix.
Free
(Essay)
4.8/5 (40)
Correct Answer:Verified
There appears to be a fan pattern, which means that the constant variance assumption was violated. We can fix the problem by making variance-stabilizing transformation of the dependent variable.
In the scatter plot, some points do not fit the same linear pattern as the others.
a.Define an outlier. How does an outlier impact the least squares regression?
b.Define an influence point. How does an influence point impact the least squares regression?
c.Is it appropriate to remove an outlier or influence point from the analysis? Explain.
(Essay)
4.8/5 (39)
Which of the following correlation coefficient estimates would not be valid?
(Multiple Choice)
4.8/5 (38)
Define multicollinearity. Provide an example where multicollinearity might be a problem.
(Essay)
4.8/5 (34)
An investigator has conducted a study where she is interested in how the amount of cadmium found in well water affects the glomerular filtration rate (GFR). The GFR can be used to assess kidney function in individuals. The investigator has collected information on potential confounders but is really interested in the relationship between cadmium levels and GFR. Describe in detail the differences in sequential sums of squares and adjusted sums or squares in the context of this problem. How might these sums of squares help the investigator to understand the contribution of cadmium levels and of confounders?
(Essay)
4.9/5 (36)
You have conducted a study among adults ages 18-45 where you were interested in the relationship between milk consumption (mL/day) and weight (lbs). a. The following table results from your linear regression analysis. Provide an interpretation for the journal article you are preparing.
 b. A reviewer reads your results provided in (a) and concludes that a 1-mL increase in milk consumption is not really informative for people reading the literature. The reviewer suggests that a 100-mL increase is more informative for an audience considering future programs for weight loss. Make this change and interpret.
(Essay)
4.8/5 (29)
Cotinine levels have been used as biomarkers to assess tobacco exposure among women. There have been questions on whether increased cotinine levels increase an individual's reactive hyperemia index (RHI), which is a measure of endothelial function and cardiovascular risk. For your study, you gathered cotinine and RHI data on 200 women. You are interested in the correlation between the two variables. You calculate a correlation (r) to be 0.017 with a 95% confidence interval (-0.2405, 0.2716). What does this suggest?
(Essay)
4.7/5 (34)
What can be said about R² when a linear regression results in an ANOVA table with a large total sum of squares and a relatively small model sum of squares?
(Multiple Choice)
4.8/5 (37)
An investigator conducted a study to find the relationship between the number of decayed, missing, or filled teeth (DMFT) and sugar consumption. The investigator produced an estimate for the correlation coefficient and provided the following statement: "The correlation between DMFT and sugar consumption is 0.7. There is a strong correlation between DMFT and sugar consumption. Therefore, it is recommended that patients be advised to reduce sugar consumption to prevent tooth decay." What is missing from this investigator's analysis?
(Essay)
4.8/5 (36)
In a meeting with a biostatistician to go over the analysis plan for your grant, the biostatistician states, "Although you are primarily interested in the relationship between exposure to second-hand smoke (SHS) and birth weight, a simple comparison of the birth weights for the SHS groups is not appropriate. However, multiple linear regression or ANCOVA can be used to help answer your research question." Explain the biostatistician's statement.
(Essay)
4.9/5 (33)
A multiple linear regression analysis is employed to control for potential confounders. Why might automated selection techniques (backward, forward, and stepwise) be inappropriate?
(Essay)
4.7/5 (33)
Data were collected on soy protein consumption and blood pressure. An investigator states that a least squares regression line was fitted to the data. What is the least squares regression line?
(Essay)
4.8/5 (30)
When a child is born, he/she may undergo ultrasounds to assess the volume size (mm³) of his/her thyroid. Low thyroid volumes can affect the growth of the infant and can also lead to future health problems. Researchers have suggested a correlation between thyroid volume size and birth weight. a.Provide conclusions based on the following table.
 b.According to the literature, gestational age is a major confounder. Explain confounder in the context of this problem. c.A multiple linear regression was performed where gestational age was included in the model:

 Provide a summary of the results for the manuscript you are preparing.
(Essay)
4.9/5 (38)
You have performed a linear regression to assess the relationship between CD4+ cell counts (y) and viral load (x). Plotting your residuals, you realize that there is a fan pattern. The residuals are clustered more tightly together around 0 for the small values of y-hat and become more spread out as you increase the values of y-hat. Provide the assumptions to the linear regression and provide at least one solution to fixing this problem.
(Essay)
4.9/5 (36)
You are interested in understanding the relationship between alcohol consumption (L/day) and prostate-specific antigen (PSA) levels. It has been suggested that as you increase your alcohol consumption, your PSA level increases; PSA and alcohol consumption have a linear relationship. Which of the following models is the appropriate statistical model?
(Multiple Choice)
4.7/5 (35)
A linear regression of age (x) on blood lead levels (y) for men who have worked in factories that manufacture car batteries is performed. The residual plots suggest there is still a pattern remaining, and you decide to add a quadratic term (age²) for age into the model. Which of the following models is now most appropriate?
(Multiple Choice)
4.8/5 (26)
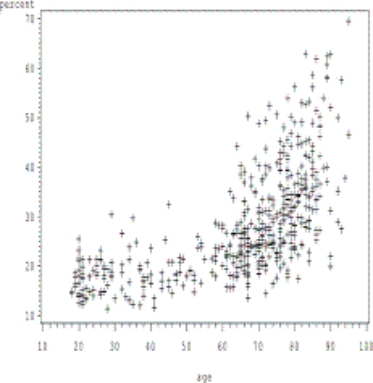
The following figure shows a scatter plot of the percent of bone loss by age. It has been suggested that there is a linear relationship between age and percent of bone loss. Is there evidence of a linear relationship in this sample? Explain
(Essay)
4.8/5 (42)
When employing a multiple linear regression analysis, you realized that the regressors cholesterol and triglycerides are highly correlated. To avoid multicollinearity, what can you do?
(Essay)
4.8/5 (36)
Filters
- Essay(0)
- Multiple Choice(0)
- Short Answer(0)
- True False(0)
- Matching(0)