Exam 3: Numerical Descriptive Measures
Exam 1: Introduction50 Questions
Exam 2: Organizing and Graphing Data93 Questions
Exam 3: Numerical Descriptive Measures92 Questions
Exam 4: Probability75 Questions
Exam 5: Discrete Random Variables and Their Probability Distribution77 Questions
Exam 6: Continuous Random Variables and the Normal Distribution74 Questions
Exam 7: Sampling Distributions76 Questions
Exam 8: Estimation of the Mean and Proportion60 Questions
Exam 9: Hypothesis Tests About the Mean and Proportion93 Questions
Exam 10: Estimation and Hypothesis Testing: Two Populations45 Questions
Exam 11: Chi-Square Tests98 Questions
Exam 12: Analysis of Variance62 Questions
Exam 13: Simple Linear Regression105 Questions
Select questions type
Use the following to answer questions :
The following data represent the ages of 15 people buying lift tickets at a ski area.
15 25 26 17 38 16 74 41 30 24 28 40 20 34 31
-What is the value of the lower inner fence?
Free
(Short Answer)
4.9/5  (33)
(33)
Correct Answer: Verified
-7
Based on the box-and-whisker plot, 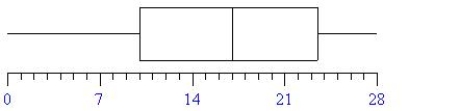 complete the table.

Free
(Essay)
4.8/5 (36)
Correct Answer:Verified

Use the following to answer questions :
The waiting times (in minutes)for 11 customers at a supermarket are:
14 9 15 4 4 7 9 11 14 2 6
-The approximate value of the 60th percentile for these data is:
Free
(Short Answer)
4.7/5 (39)
Correct Answer:Verified
9
According to the empirical rule,the percentage of values that fall within three standard deviations of the mean is approximately:
(Multiple Choice)
4.8/5 (39)
Use the following to answer questions :
The annual salaries of six employees of a company are as follows:
$22,000 $35,000 $22,000 $46,000 $57,000 $51,000
-The mode of the salaries of these employees is:
(Short Answer)
4.8/5 (29)
Use the following to answer questions :
You have just recorded the waiting times for a random sample of 50 customers who visited Elmo's Pizza Shop.The following table gives the frequency distribution of waiting times (in minutes)for these customers.
 -The mean waiting time,rounded to two decimal places,is:
(Short Answer)
4.9/5 (34)
Use the following to answer questions :
The following data represent the ages of 15 people buying lift tickets at a ski area.
15 25 26 17 38 16 74 41 30 24 28 40 20 34 31
-What is the median of these data?
(Short Answer)
4.9/5 (36)
The scores of eight students taking a mathematics test are 87,93,76,7,84,90,95,and 93.The best measure of central tendency in this case is the:
(Multiple Choice)
4.9/5 (40)
The percentile rank of a value in a data set is 43.This means that:
(Multiple Choice)
4.7/5 (36)
Use the following to answer questions :
The following data represent the ages of 15 people buying lift tickets at a ski area.
15 25 26 17 38 16 74 41 30 24 28 40 20 34 31
-What is the value of the first quartile?
(Short Answer)
4.9/5 (32)
Use the following to answer questions :
The work experiences (in years)of 14 employees of a company are
8 21 11 4 14 17 11 8 8 7 2 11 27 6
-The first quartile for these data is:
(Short Answer)
4.7/5 (31)
You just dropped an outlier from a data set.The value of the mean:
(Multiple Choice)
4.9/5 (38)
The summary measure obtained by taking the difference between the minimum and maximum values in a data set is the:
(Multiple Choice)
4.9/5 (37)
Use the following to answer questions :
The times (in minutes)taken by a sample of nine students to complete a statistics test are:
52 47 57 33 39 43 52 41 36
-The standard deviation of these times,rounded to three decimal places,is:
(Short Answer)
4.7/5 (35)
The annual incomes of all MBA degree holders working in Los Angeles have a bell-shaped distribution with a mean of $71,000 and a standard deviation of $8,000.According to the empirical rule,the percentage of MBA degree holders working in Los Angeles who have an annual income of $63,000 to $79,000 is approximately:
(Multiple Choice)
4.8/5 (36)
Use the following to answer questions :
The following data represent the ages of 15 people buying lift tickets at a ski area.
15 25 26 17 38 16 74 41 30 24 28 40 20 34 31
-What is the standard deviation of these data,rounded to two decimal places?
(Short Answer)
4.9/5 (32)
The annual incomes of all MBA degree holders working in Los Angeles have a bell-shaped distribution with a mean of $78,000 and a standard deviation of $11,000.According to the empirical rule,the percentage of MBA degree holders working in Los Angeles who have an annual income of $56,000 to $100,000 is approximately:
(Multiple Choice)
4.9/5 (39)
Filters
- Essay(0)
- Multiple Choice(0)
- Short Answer(0)
- True False(0)
- Matching(0)