Exam 3: Numerical Descriptive Measures
Exam 1: Introduction50 Questions
Exam 2: Organizing and Graphing Data93 Questions
Exam 3: Numerical Descriptive Measures92 Questions
Exam 4: Probability75 Questions
Exam 5: Discrete Random Variables and Their Probability Distribution77 Questions
Exam 6: Continuous Random Variables and the Normal Distribution74 Questions
Exam 7: Sampling Distributions76 Questions
Exam 8: Estimation of the Mean and Proportion60 Questions
Exam 9: Hypothesis Tests About the Mean and Proportion93 Questions
Exam 10: Estimation and Hypothesis Testing: Two Populations45 Questions
Exam 11: Chi-Square Tests98 Questions
Exam 12: Analysis of Variance62 Questions
Exam 13: Simple Linear Regression105 Questions
Select questions type
Use the following to answer questions :
The following data represent the ages of 15 people buying lift tickets at a ski area.
15 25 26 17 38 16 74 41 30 24 28 40 20 34 31
-What is the value of the interquartile range?
(Short Answer)
5.0/5  (33)
(33)
Use the following to answer questions :
The work experiences (in years)of 14 employees of a company are
8 21 11 4 14 17 11 8 8 7 2 11 27 6
-The second quartile for these data is:
(Short Answer)
4.9/5 (30)
According to the empirical rule,the percentage of values that fall outside two standard deviations of the mean is approximately:
(Multiple Choice)
4.9/5 (40)
According to the empirical rule,the percentage of values that fall within two standard deviations of the mean is approximately:
(Multiple Choice)
4.9/5 (36)
Use the following to answer questions :
The annual salaries of six employees of a company are as follows:
$22,000 $35,000 $22,000 $46,000 $57,000 $51,000
-The median salary of these employees is:
(Short Answer)
4.9/5 (40)
Use the following to answer questions :
The work experiences (in years)of 14 employees of a company are
8 21 11 4 14 17 11 8 8 7 2 11 27 6
-Which of the following does a box-and-whisker plot not show?
(Multiple Choice)
4.8/5 (29)
Use the following to answer questions :
The following table gives the frequency distribution of prices for a sample of 30 college textbooks.
 -The standard deviation of the textbook prices,rounded to two decimal places,is:
(Short Answer)
4.8/5 (45)
Let s1,s2,and s3 be the standard deviations of the bell-shaped graphs I,II,and III,respectively.Place them in increasing order. 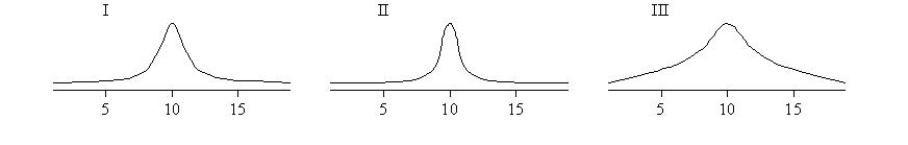
(Multiple Choice)
4.7/5 (39)
Use the following to answer questions :
The waiting times (in minutes)for 11 customers at a supermarket are:
14 9 15 4 4 7 9 11 14 2 6
-The second quartile for these data is:
(Short Answer)
4.9/5 (47)
Use the following to answer questions :
You have just recorded the waiting times for a random sample of 50 customers who visited Elmo's Pizza Shop.The following table gives the frequency distribution of waiting times (in minutes)for these customers.
 -The value of
  is:
is:
(Short Answer)
4.9/5 (38)
A numerical measure calculated from population data is called a(n):
(Multiple Choice)
4.9/5 (47)
Use the following to answer questions :
Data concerning the time between failures (in hours of operation)for a computer printer have been recorded,and the first quartile equals 38 hours,the second quartile equals 59 hours,and the third quartile equals 87 hours.
-The value for the lower inner fence equals
(Short Answer)
4.8/5 (48)
The ages of all high school teachers in New York state have a bell-shaped distribution with a mean of 45 years and a standard deviation of 7 years.According to the empirical rule,the percentage of teachers in this state who are 24 to 66 years old is approximately:
(Multiple Choice)
4.8/5 (36)
The ages of all high school teachers in New York state have a bell-shaped distribution with a mean of 43 years and a standard deviation of 6 years.According to the empirical rule,the percentage of teachers in this state who are 31 to 55 years old is approximately:
(Multiple Choice)
4.8/5 (46)
Use the following to answer questions :
The annual salaries of six employees of a company are as follows:
$22,000 $35,000 $22,000 $46,000 $57,000 $51,000
-The mean salary of these employees is:
(Short Answer)
4.9/5 (31)
Use the following to answer questions :
The following data represent the ages of 15 people buying lift tickets at a ski area.
15 25 26 17 38 16 74 41 30 24 28 40 20 34 31
-Create a boxplot of the data.Describe the features of the distribution.
(Essay)
4.8/5 (29)
Use the following to answer questions :
The work experiences (in years)of 14 employees of a company are
8 21 11 4 14 17 11 8 8 7 2 11 27 6
-The approximate value of the 70th percentile for these data is:
(Short Answer)
4.8/5 (29)
Use the following to answer questions :
The following data represent the ages of 15 people buying lift tickets at a ski area.
15 25 26 17 38 16 74 41 30 24 28 40 20 34 31
-What is the mean of these data,rounded to two decimal places?
(Short Answer)
5.0/5 (40)
According to the empirical rule,the percentage of values that fall within one standard deviation of the mean is approximately:
(Multiple Choice)
4.9/5 (34)
An outlier influences which of the following summary measures the most?
(Multiple Choice)
4.7/5 (41)
Filters
- Essay(0)
- Multiple Choice(0)
- Short Answer(0)
- True False(0)
- Matching(0)