Exam 11: Power Point: Presentation Design
Exam 1: Access: Introduction to Access138 Questions
Exam 2: Access: Tables and Queries in Relational Databases130 Questions
Exam 3: Access: Using Queries to Make Decisions120 Questions
Exam 4: Access: Creating and Using Professional Forms and Reports132 Questions
Exam 5: Excel : Introduction to Excel100 Questions
Exam 6: Excel : Formulas and Functions100 Questions
Exam 7: Excel : Charts100 Questions
Exam 8: Excel : Datasets and Tables100 Questions
Exam 9: Power Point: Creating a Basic Presentation100 Questions
Exam 10: Power Point: Presentation Development79 Questions
Exam 11: Power Point: Presentation Design100 Questions
Exam 12: Power Point: Enhancing With Multimedia97 Questions
Exam 13: Word: Introduction to Word99 Questions
Exam 14: Word: Document Presentation100 Questions
Exam 15: Word: Document Productivity100 Questions
Exam 16: Word: Collaboration and Research98 Questions
Exam 17: Office 2016 Common Features100 Questions
Exam 18: Working With an Operating System100 Questions
Select questions type
The picture fill option enables you to insert an image from a file into a shape.
(True/False)
4.9/5  (49)
(49)
Match each of the following terms to their meanings:
I. Shape
II. Infographic
III. Lock Drawing Mode
IV. Flow chart
V. Connector
A. Used to create multiple shapes of the same type
B. Geometric or non-geometric object used to create an illustration or highlight information
C. Illustration showing the sequence of a project
D. Line with connection points at each end
E. Visual representation of data or knowledge
(Essay)
4.7/5 (32)
Rather than using shapes, ________ uses special effects based on text.
(Multiple Choice)
4.8/5 (42)
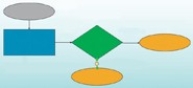 In the figure shown above, the blue rectangular object in the flow chart represents a(n)________.
(Multiple Choice)
4.8/5 (31)
In a flow chart, a(n)________ shape indicates where a decision is made in the chart.
(Multiple Choice)
4.7/5 (41)
You would use a ________ to illustrate the sequence of a plan containing steps.
(Multiple Choice)
4.7/5 (44)
 In the figure shown above, the green diamond shaped object in the flow chart represents a(n)________.
(Short Answer)
4.8/5 (28)
A(n)________ is point where a curve ends or the point where two line segments meet in a shape.
(Short Answer)
4.8/5 (35)
 In the figure shown above, the two original shapes a blue square and a red circle are shown on the left. The shape shown on the right is the result of applying a(n)________ merge.
(Multiple Choice)
4.9/5 (34)
Because it is math-based a(n)________ image retains perfect clarity when it is edited or resized.
(Short Answer)
4.8/5 (39)
A(n)________SmartArt object is used display a decision tree or an organization chart.
(Multiple Choice)
4.9/5 (32)
 The object shown in the figure shown above, depicts a flow chart.
(True/False)
4.8/5 (35)
________ is a math-based image that retains perfect clarity when edited or resized.
(Multiple Choice)
4.8/5 (33)
 In the figure shown above, the two original shapes a blue square and a red circle are shown on the left. The shape shown on the right is the result of applying a(n)________ merge.
(Short Answer)
4.8/5 (36)
Filters
- Essay(0)
- Multiple Choice(0)
- Short Answer(0)
- True False(0)
- Matching(0)