Exam 13: Financial Statement Analysis
Exam 1: The Financial Statements190 Questions
Exam 2: Transaction Analysis196 Questions
Exam 3: Accrual Accounting Income223 Questions
Exam 4: Internal Control Cash188 Questions
Exam 5: Short-Term Investments Receivables202 Questions
Exam 6: Inventory Cost of Goods Sold168 Questions
Exam 7: Plant Assets, Natural Resources, Intangibles194 Questions
Exam 8: Long-Term Investments the Time Value of Money171 Questions
Exam 9: Liabilities193 Questions
Exam 10: Stockholders Equity164 Questions
Exam 11: Evaluating Performance: Earnings Quality, the Income Statement, Statement of Comprehensive Income119 Questions
Exam 12: The Statement of Cash Flows145 Questions
Exam 13: Financial Statement Analysis127 Questions
Select questions type
If days' sales in receivables are growing faster than for other companies in the industry, a cash shortage may be looming.
(True/False)
5.0/5  (44)
(44)
For investment analysis, it is generally considered more useful to calculate the percentage changes in the dollar amounts of financial statement line items from year to year instead of using the absolute dollar amounts.
(True/False)
4.8/5 (34)
A financial statement that shows each line item as a percentage of one key item on the statement is referred to as a:
(Multiple Choice)
4.7/5 (38)
On a statement of cash flows (indirect method), which item is reported as a line item under cash from operating activities?
(Multiple Choice)
4.9/5 (41)
Net cash provided by operating activities that is consistently lower than net income may imply that:
(Multiple Choice)
4.8/5 (44)
What do the price-earnings ratio and dividend yield have in common?
(Multiple Choice)
4.9/5 (36)
How is the trend percentage for sales in 2017 computed? The base year is 2012.
(Multiple Choice)
4.7/5 (39)
Year to year percentage changes in line items from comparative financial statements is called:
(Multiple Choice)
4.9/5 (43)
On a statement of cash flows of a healthy company, net income would ordinarily be:
(Multiple Choice)
4.9/5 (39)
Marie's Clothing Store had an accounts receivable balance of $440,000 at the beginning of the year and a year-end balance of $600,000. Net credit sales for the year totaled $3,600,000. The average collection period of the receivables was: (Round any intermediary calculations to two decimal places and your final answer to the nearest day.)
(Multiple Choice)
4.7/5 (37)
Red flags in financial statement analysis can include all of the following EXCEPT:
(Multiple Choice)
4.8/5 (42)
Which of the following is typically used as the base in a vertical analysis of an income statement?
(Multiple Choice)
4.9/5 (35)
Szidon Company reports the following data: 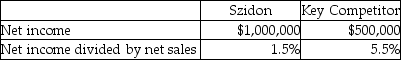 Using benchmarking, what can be said about Szidon Company?
(Multiple Choice)
4.8/5 (36)
Zebra Company reports the following figures for the years ending December 31, 2017 and 2016: 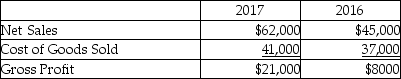 What are the percentage changes from 2016 to 2017 for Net Sales, Cost of Goods Sold and Gross Profit, respectively? (Round your final answers to one decimal place, X.X%)
(Multiple Choice)
4.9/5 (39)
You are the CEO of Company A and you are using an industry leader (Leader Company)for benchmarking. Company A is much smaller than Company B in terms of total assets and total sales revenue. You should compare the:
(Multiple Choice)
4.8/5 (41)
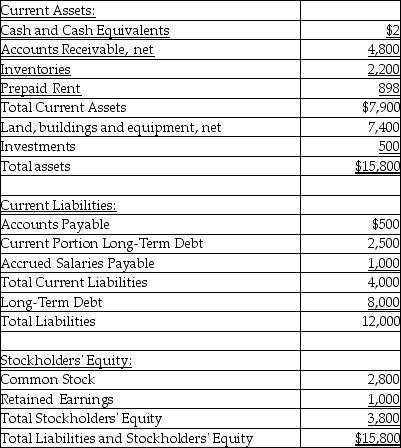
The balance sheet at December 31, 2017 for Zumba Company follows:
in thousands of dollars, unless otherwise specified
 Additional information follows:
1. Net income for the year ended December 31, 2017 is $2,020.
2. Cost of goods sold for the year ended December 31, 2017 is $4,400.
3. Inventory on January 1, 2017 is $1,800.
4. Accounts Receivable, net on January 1, 2017 are $4,400.
5. Total assets on January 1, 2017 are $20,000.
6. Net credit sales for the year ended December 31, 2017 are $14,600.
7. Net income before interest and taxes for the year ended December 31, 2017 is $4,800.
8. Interest expense for the year ended December 31, 2017 is $550.
9. Total stockholders' equity on January 1, 2017 is $3,500.
Compute the following ratios:
1. Current ratio
2. Quick ratio
3. Accounts receivable turnover
4. Days' inventory outstanding
5. Times interest earned
6. Return on assets
7. Return on equity
Additional information follows:
1. Net income for the year ended December 31, 2017 is $2,020.
2. Cost of goods sold for the year ended December 31, 2017 is $4,400.
3. Inventory on January 1, 2017 is $1,800.
4. Accounts Receivable, net on January 1, 2017 are $4,400.
5. Total assets on January 1, 2017 are $20,000.
6. Net credit sales for the year ended December 31, 2017 are $14,600.
7. Net income before interest and taxes for the year ended December 31, 2017 is $4,800.
8. Interest expense for the year ended December 31, 2017 is $550.
9. Total stockholders' equity on January 1, 2017 is $3,500.
Compute the following ratios:
1. Current ratio
2. Quick ratio
3. Accounts receivable turnover
4. Days' inventory outstanding
5. Times interest earned
6. Return on assets
7. Return on equity
(Essay)
4.8/5 (35)
Mussa Corporation reports the following data:  In vertical analysis, the cost of goods sold percentage is closest to: (Round your final answer to the nearest whole percentage, X%)
(Multiple Choice)
4.8/5 (42)
Filters
- Essay(0)
- Multiple Choice(0)
- Short Answer(0)
- True False(0)
- Matching(0)