Exam 16: How to Read, Analyze, and Interpret Financial Reports
Exam 1: Whole Number: How to Dissect and Solve Word Problems55 Questions
Exam 2: Fractions71 Questions
Exam 3: Decimals62 Questions
Exam 4: Banking67 Questions
Exam 5: Solving for the Unknown: a How to Approach to Solving Equations65 Questions
Exam 6: Percents and Their Applications48 Questions
Exam 7: Discounts: Trade and Cash68 Questions
Exam 8: Markups and Markdowns: Perishables and Breakeven Analysis62 Questions
Exam 9: Payroll62 Questions
Exam 10: Simple Interest49 Questions
Exam 11: Promissory Notes, Simple Discount Notes and the Discount Process56 Questions
Exam 12: Compound Interest and Present Value56 Questions
Exam 13: Annuities and Sinking Funds45 Questions
Exam 14: Installment Buying38 Questions
Exam 15: The Cost of Home Ownership49 Questions
Exam 16: How to Read, Analyze, and Interpret Financial Reports74 Questions
Exam 17: Appreciation53 Questions
Exam 18: Inventory and Overhead56 Questions
Exam 19: Sales Excise and Property Taxes55 Questions
Exam 20: Life, Fire and Auto Insurance57 Questions
Exam 21: Stocks, Bonds and Mutual Funds61 Questions
Exam 22: Business Statistics52 Questions
Select questions type
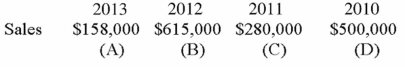
Complete using trend analyses for sales. (Round to nearest percent and use 2010 as the base year.)
(Essay)
4.8/5  (39)
(39)
Given the following: 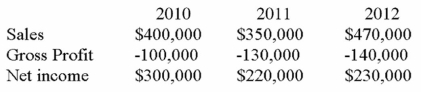 By trend analysis (base year is 2010), sales in 2012 to the nearest percent of the base year is:
(Multiple Choice)
4.9/5 (33)
The total debt to total assets of Logan Company was .71. The total of Logan's assets was $270,000. The amount of total debt is:
(Multiple Choice)
4.7/5 (31)
Horizontal analysis can analyze balance sheets for two or more periods.
(True/False)
4.8/5 (25)
Reductions in the selling price for early payment are called sales returns and allowances.
(True/False)
4.9/5 (35)
Selecting a base year and expressing each amount as a percent of the base year amount is called:
(Multiple Choice)
4.8/5 (38)
Complete the following the current ratio for the following: Total current assets = $12,000; current liabilities = $10,000
(Multiple Choice)
4.9/5 (23)
Filters
- Essay(0)
- Multiple Choice(0)
- Short Answer(0)
- True False(0)
- Matching(0)