Exam 7: Production Inputs and Cost Building Blocks for Supply Analysis
Exam 1: What Is Economics229 Questions
Exam 2: The Economy Myth and Reality154 Questions
Exam 3: The Fundamental Economic Problem Scarcity and Choice254 Questions
Exam 4: Supply and Demand an Initial Look287 Questions
Exam 5: Consumer Choice Individual and Market Demand190 Questions
Exam 6: Demand and Elasticity210 Questions
Exam 7: Production Inputs and Cost Building Blocks for Supply Analysis206 Questions
Exam 8: Output Price and Profit the Importance of Marginal Analysis188 Questions
Exam 9: Securities Business Finance and the Economy the Tail That Wags the Dog201 Questions
Exam 10: The Firm and the Industry Under Perfect Competition194 Questions
Exam 11: Monopoly206 Questions
Exam 12: Between Competition and Monopoly228 Questions
Exam 13: Limiting Market Power Regulation and Antitrust144 Questions
Exam 14: The Case for Free Markets the Price System224 Questions
Exam 15: The Shortcomings of Free Markets207 Questions
Exam 16: Externalities the Environment and Natural Resources216 Questions
Exam 17: Taxation and Resource Allocation219 Questions
Exam 18: Pricing the Factors of Production231 Questions
Exam 19: Labor and Entrepreneurship the Human Inputs267 Questions
Exam 20: Poverty Inequality and Discrimination169 Questions
Exam 21: Is Us Economic Leadership Threatened75 Questions
Exam 22: International Trade and Comparative Advantage221 Questions
Select questions type
Figure 7-14 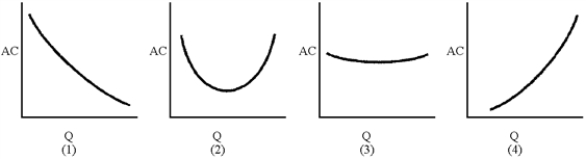 -Of the long-run AC curves in Figure 7-14, which displays increasing returns to scale for all levels of output?
(Multiple Choice)
4.8/5  (42)
(42)
Marginal revenue product equals the marginal physical product multiplied by the quantity demanded.
(True/False)
4.8/5 (29)
The case of production with a single variable input is analogous to
(Multiple Choice)
4.8/5 (34)
The firm can calculate all points on its total cost curve if it knows
(Multiple Choice)
4.7/5 (23)
The marginal revenue product of an hour of labor used in steel production is equal to
(Multiple Choice)
4.7/5 (28)
If the price of one input changes, the firm will change its use of that input only.
(True/False)
4.8/5 (33)
The short-run average cost curve shows the lowest possible average cost corresponding to each output level, assuming that all inputs are variable.
(True/False)
4.8/5 (36)
The expansion path of product indifference curves shows the cost-minimizing combination of inputs.
(True/False)
4.9/5 (37)
Figure 7-1 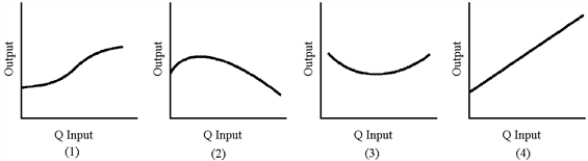 -Of the graphs in Figure 7-1, which best represents marginal physical product?
(Multiple Choice)
4.7/5 (35)
An airline industry study recently reported, "Evidence is abundant that larger firms are not more efficient or less costly simply because they are larger.In fact, other things equal, the largest carriers tend to have a higher level of unit costs, possibly caused by the difficulties of managing an airline of large size." This means that
(Multiple Choice)
4.9/5 (33)
Figure 7-1
-In Figure 7-1, which graph best represents total physical product with diminishing returns?
(Multiple Choice)
4.8/5 (32)
A production indifference curve describes the input combinations that will produce a given output.
(True/False)
4.7/5 (42)
Figure 7-9 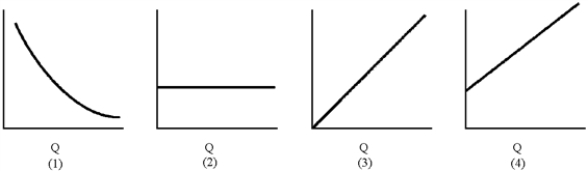 -Of the graphs in Figure 7-9, which represents average fixed cost?
(Multiple Choice)
4.9/5 (35)
Cost minimization requires that a firm equate the ratio of marginal products of inputs to the ratio of input prices.
(True/False)
4.9/5 (29)
In August 1988, the Los Angeles Kings hired Wayne Gretzky for $15 million in cash.The hockey team's decision must have been based on the expectation that
(Multiple Choice)
4.9/5 (32)
Filters
- Essay(0)
- Multiple Choice(0)
- Short Answer(0)
- True False(0)
- Matching(0)