Exam 7: Production Inputs and Cost Building Blocks for Supply Analysis
Exam 1: What Is Economics229 Questions
Exam 2: The Economy Myth and Reality154 Questions
Exam 3: The Fundamental Economic Problem Scarcity and Choice254 Questions
Exam 4: Supply and Demand an Initial Look287 Questions
Exam 5: Consumer Choice Individual and Market Demand190 Questions
Exam 6: Demand and Elasticity210 Questions
Exam 7: Production Inputs and Cost Building Blocks for Supply Analysis206 Questions
Exam 8: Output Price and Profit the Importance of Marginal Analysis188 Questions
Exam 9: Securities Business Finance and the Economy the Tail That Wags the Dog201 Questions
Exam 10: The Firm and the Industry Under Perfect Competition194 Questions
Exam 11: Monopoly206 Questions
Exam 12: Between Competition and Monopoly228 Questions
Exam 13: Limiting Market Power Regulation and Antitrust144 Questions
Exam 14: The Case for Free Markets the Price System224 Questions
Exam 15: The Shortcomings of Free Markets207 Questions
Exam 16: Externalities the Environment and Natural Resources216 Questions
Exam 17: Taxation and Resource Allocation219 Questions
Exam 18: Pricing the Factors of Production231 Questions
Exam 19: Labor and Entrepreneurship the Human Inputs267 Questions
Exam 20: Poverty Inequality and Discrimination169 Questions
Exam 21: Is Us Economic Leadership Threatened75 Questions
Exam 22: International Trade and Comparative Advantage221 Questions
Select questions type
A total cost curve shows the largest amount of a product a firm can produce with a minimum cost.
(True/False)
4.9/5  (37)
(37)
Figure 7-11 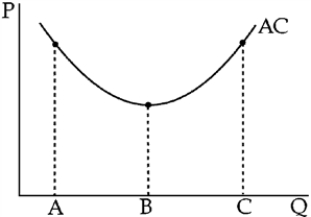 -Figure 7-11 shows an average cost curve with points on it that correspond to three quantity levels.Which of the following statements must be wrong?
(Multiple Choice)
4.8/5 (40)
Table 7-2
 -Table 7-2 contains information on widget production.The marginal physical product of the sixth pound of plastic is ____.
(Multiple Choice)
4.8/5 (26)
The least costly way to produce a given level of output is indicated by the point of tangency between a budget line and the production indifference curve corresponding to that level of output.
(True/False)
4.9/5 (36)
The law of diminishing marginal returns is the same as increasing returns to scale.
(True/False)
4.8/5 (34)
A change in input prices will change the location of the budget line.
(True/False)
4.9/5 (45)
If in some range of production average cost is falling, the firm is experiencing
(Multiple Choice)
4.9/5 (29)
If the marginal physical product of more labor is twice as high as the marginal physical product of more machinery, a rational firm should
(Multiple Choice)
4.8/5 (39)
If significant economies of scale are present, large firms will be much more efficient producers than small firms.
(True/False)
4.7/5 (27)
Are returns to a single input and returns to scale one and the same? Explain.
(Essay)
4.7/5 (36)
Figure 7-13 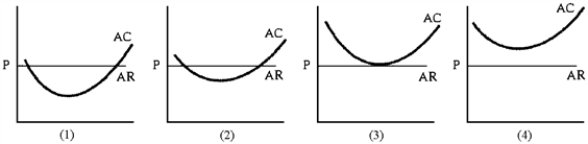 -Figure 7-13 shows the average total cost curves of four firms that produce milk.Some of the dairies are more productive.AR = P is the long-run price of milk.How many of these dairies will remain in the industry in the long run?
(Multiple Choice)
4.8/5 (38)
If the MRP per dollar is greater for labor than that for tools, a producer should spend more money on labor than originally planned and less on tools.How long can he continue this switch in spending? Why?
(Essay)
4.8/5 (36)
If on a given product indifference curve a firm is using an insufficient (nonoptimal) amount of one of its inputs
(Multiple Choice)
4.8/5 (26)
Figure 7-9 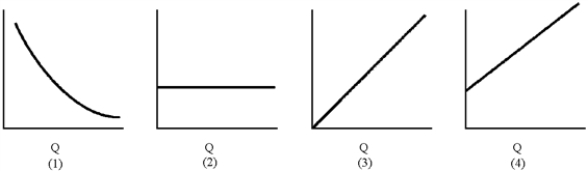 -Of the graphs in Figure 7-9, which represents total fixed cost?
(Multiple Choice)
4.9/5 (27)
Table 7-1
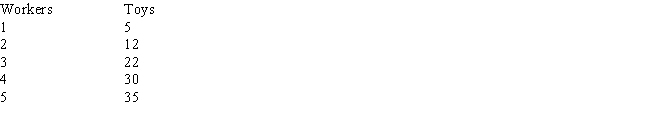 -In Table 7-1, the marginal physical product of labor after the addition of the fourth worker is
(Multiple Choice)
4.9/5 (32)
Figure 7-8 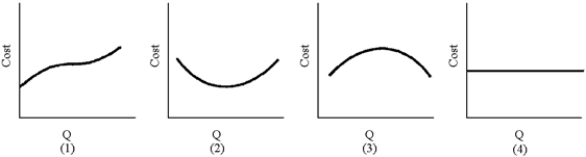 -Of the graphs in Figure 7-8, which represents fixed cost?
(Multiple Choice)
4.7/5 (31)
Filters
- Essay(0)
- Multiple Choice(0)
- Short Answer(0)
- True False(0)
- Matching(0)