Exam 4: Supply and Demand an Initial Look
Exam 1: What Is Economics229 Questions
Exam 2: The Economy Myth and Reality154 Questions
Exam 3: The Fundamental Economic Problem Scarcity and Choice254 Questions
Exam 4: Supply and Demand an Initial Look287 Questions
Exam 5: Consumer Choice Individual and Market Demand190 Questions
Exam 6: Demand and Elasticity210 Questions
Exam 7: Production Inputs and Cost Building Blocks for Supply Analysis206 Questions
Exam 8: Output Price and Profit the Importance of Marginal Analysis188 Questions
Exam 9: Securities Business Finance and the Economy the Tail That Wags the Dog201 Questions
Exam 10: The Firm and the Industry Under Perfect Competition194 Questions
Exam 11: Monopoly206 Questions
Exam 12: Between Competition and Monopoly228 Questions
Exam 13: Limiting Market Power Regulation and Antitrust144 Questions
Exam 14: The Case for Free Markets the Price System224 Questions
Exam 15: The Shortcomings of Free Markets207 Questions
Exam 16: Externalities the Environment and Natural Resources216 Questions
Exam 17: Taxation and Resource Allocation219 Questions
Exam 18: Pricing the Factors of Production231 Questions
Exam 19: Labor and Entrepreneurship the Human Inputs267 Questions
Exam 20: Poverty Inequality and Discrimination169 Questions
Exam 21: Is Us Economic Leadership Threatened75 Questions
Exam 22: International Trade and Comparative Advantage221 Questions
Select questions type
Figure 4-18 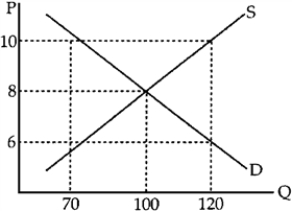 -In Figure 4-18, there would be a surplus of T-shirts if the price were
(Multiple Choice)
4.7/5  (33)
(33)
"Demand" is a series of quantities demanded, one for each person in the market.
(True/False)
5.0/5 (33)
What are the major problems that will tend to arise if there are legal limits on the movement of prices?
(Multiple Choice)
4.9/5 (34)
If the U.S.government starts to sell off its stockpile of cheese,
(Multiple Choice)
4.8/5 (28)
The ____ the demand curve for a good, the ____ the change in equilibrium quantity after a shift of the supply curve.
(Multiple Choice)
4.9/5 (45)
Figure 4-15 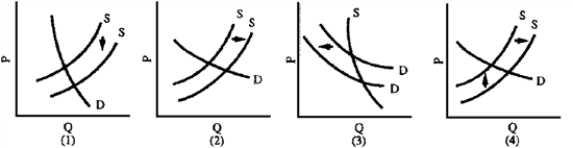 -Recycling of newspapers has been undermined by its success.The supply of old papers, gathered diligently by those concerned with the environment, has increased dramatically, as has the number of firms that convert the material into recycled newsprint.The quantity demanded has remained relatively stable despite falling prices because newspapers consider recycled newsprint an inferior substitute for regular newsprint.Consequently, the price of recycled newsprint has fallen below the cost of production; recycling firms are going out of business; mountains of old newspapers are left behind.Which graph in Figure 4-15 best illustrates this situation?
(Multiple Choice)
4.7/5 (31)
The price for labor is the wage rate.What happens to the supply of labor if wages increase?
(Multiple Choice)
4.8/5 (44)
A decrease in price of a certain good most likely will lead to
(Multiple Choice)
4.8/5 (39)
A change in the price of hamburgers will change the supply of hot dogs.
(True/False)
4.8/5 (40)
From 2007 to 2008, the Federal Reserve System reduced interest rates, the price that borrowers pay.As a result, economists expected that the supply of money would
(Multiple Choice)
4.9/5 (40)
Throughout history, governments have used price controls to
(Multiple Choice)
4.9/5 (36)
An increase in the number of nursing homes and community health centers and the expansion of home care has led to an increase in the demand for nurses.At the same time, improving opportunities for women in business have reduced the supply of nurses.Hospitals, the major employers of nurses, have resisted wage increases.The resulting situation could be described as
(Multiple Choice)
4.9/5 (38)
In January, 2,500 quarts of ice cream are sold in Boston at $2 a quart.In February, 3,000 quarts are sold at $2.50 a quart.This change in quantity sold and price may have been caused by
(Multiple Choice)
4.9/5 (42)
A change in the price of a good has no effect on the supply schedule.
(True/False)
4.9/5 (39)
A demand curve shows the relationship between price and quantity demanded only so long as all other things are held constant.
(True/False)
5.0/5 (48)
Figure 4-23 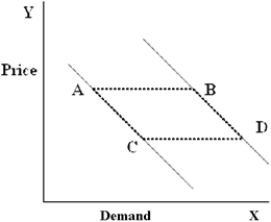 -In Figure 4-23, which movement will be caused by changes in income?
(Multiple Choice)
4.8/5 (37)
Figure 4-14 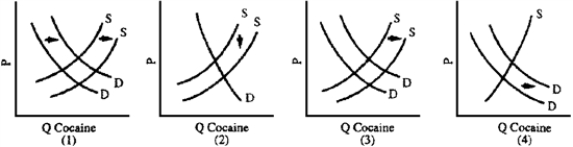 -Frustrated by the cost and ineffectiveness of the war on drugs, the U.S.government could consider "decriminalization" of the use and sale of cocaine.Critics contend that lower prices will expand drug use and that decriminalization will remove the stigma and danger from arrest associated with drug use, thus further increasing the demand and number of addicts.Which graph in Figure 4-14 best illustrates the critics' case?
(Multiple Choice)
4.8/5 (36)
Table 4-1
Use this table for the following questions.
 -Refer to Table 4-1.What is the equilibrium price in the example above?
(Multiple Choice)
4.7/5 (36)
Filters
- Essay(0)
- Multiple Choice(0)
- Short Answer(0)
- True False(0)
- Matching(0)