Exam 4: Supply and Demand an Initial Look
Exam 1: What Is Economics229 Questions
Exam 2: The Economy Myth and Reality154 Questions
Exam 3: The Fundamental Economic Problem Scarcity and Choice254 Questions
Exam 4: Supply and Demand an Initial Look287 Questions
Exam 5: Consumer Choice Individual and Market Demand190 Questions
Exam 6: Demand and Elasticity210 Questions
Exam 7: Production Inputs and Cost Building Blocks for Supply Analysis206 Questions
Exam 8: Output Price and Profit the Importance of Marginal Analysis188 Questions
Exam 9: Securities Business Finance and the Economy the Tail That Wags the Dog201 Questions
Exam 10: The Firm and the Industry Under Perfect Competition194 Questions
Exam 11: Monopoly206 Questions
Exam 12: Between Competition and Monopoly228 Questions
Exam 13: Limiting Market Power Regulation and Antitrust144 Questions
Exam 14: The Case for Free Markets the Price System224 Questions
Exam 15: The Shortcomings of Free Markets207 Questions
Exam 16: Externalities the Environment and Natural Resources216 Questions
Exam 17: Taxation and Resource Allocation219 Questions
Exam 18: Pricing the Factors of Production231 Questions
Exam 19: Labor and Entrepreneurship the Human Inputs267 Questions
Exam 20: Poverty Inequality and Discrimination169 Questions
Exam 21: Is Us Economic Leadership Threatened75 Questions
Exam 22: International Trade and Comparative Advantage221 Questions
Select questions type
Exhibit 4-1
The following are the equations for the supply and demand curves in the market for weezils:
where Qd is the quantity demanded, Qs is the quantity supplied, and P is the price per weezil in dollars.
 -Refer to Exhibit 4-1.According to the data given, when the market is in Equilibrium, how many weezils are sold?
(Multiple Choice)
4.9/5  (36)
(36)
Figure 4-4 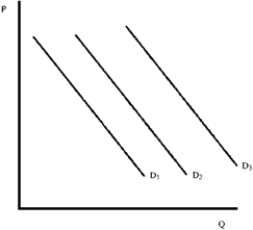 -Assume that Figure 4-4 shows demand for steak.An increase in income of buyers will change demand from
(Multiple Choice)
4.9/5 (24)
Since rent controls have been in effect in New York City, apartments have been more plentiful.
(True/False)
4.8/5 (42)
Governments of market-oriented economies never tamper with the price mechanism.
(True/False)
4.8/5 (37)
If supply increases, the equilibrium price will rise and the equilibrium quantity will fall.
(True/False)
4.7/5 (39)
A shift of the demand curve for a good occurs whenever new technologies make inputs used in producing that good available at lower prices.
(True/False)
4.8/5 (38)
If the demand for steak shifts to the right, the most likely explanation is that
(Multiple Choice)
4.7/5 (41)
Drawing the supply curve and the demand curve on the same graph helps show how price is determined.
(True/False)
4.7/5 (42)
An important assumption that is made when constructing a demand schedule is that
(Multiple Choice)
4.7/5 (34)
Figure 4-4
-Assume that Figure 4-4 shows demand for orange juice.An increase in the price of soda will change demand from
(Multiple Choice)
4.8/5 (26)
The demand curve for a good connects points describing how much consumers
(Multiple Choice)
4.8/5 (37)
Figure 4-12 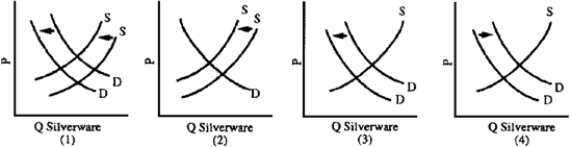 -Studies at Cornell University revealed that chickens grow 2 percent larger when a red mitten is placed in their cage and Vivaldi is played in the coop.Resultant feed savings are estimated at $60 million a year.In the chicken market, the
(Multiple Choice)
4.9/5 (34)
Any factor that shifts the demand curve to the left but does not affect the supply curve will lower the equilibrium price and raise the equilibrium quantity.
(True/False)
4.8/5 (38)
Figure 4-12
-The price of gasoline has risen and the quantity sold has fallen.This was likely caused by
(Multiple Choice)
4.9/5 (35)
For more than a thousand years, the Catholic Church required its members to abstain from meat on Fridays.Catholics customarily ate fish on Friday.After 1966 abstinence from meat on Fridays was no longer required.Consequently, the
(Multiple Choice)
4.9/5 (40)
George Washington's troops at Valley Forge were almost destroyed by price controls.
(True/False)
4.8/5 (42)
During the American Revolution, the Pennsylvania legislature enacted price controls on essential commodities.The result of this legislation was
(Multiple Choice)
4.9/5 (34)
The amount of a good sold in a market at a particular price cannot exceed the quantity
(Multiple Choice)
5.0/5 (32)
If new manufacturers enter the computer industry, then, holding all other things constant,
(Multiple Choice)
4.8/5 (35)
Figure 4-6 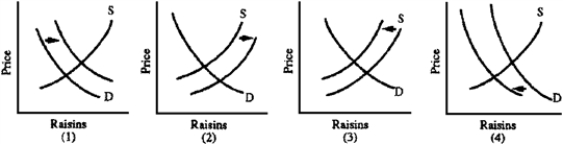 -How much the quantity of a good traded changes after a shift of the supply curve depends on
(Multiple Choice)
4.7/5 (47)
Filters
- Essay(0)
- Multiple Choice(0)
- Short Answer(0)
- True False(0)
- Matching(0)