Exam 2: Data
Exam 1: Stats Start Here115 Questions
Exam 2: Data150 Questions
Exam 3: Displaying and Describing Categorical Data110 Questions
Exam 4: Displaying and Comparing Qualitative Data84 Questions
Exam 5: Understanding and Comparing Distributions103 Questions
Exam 6: The Standard Deviation As a Ruler and the Normal Model74 Questions
Exam 7: Scatterplots, Association, and Correlation40 Questions
Select questions type
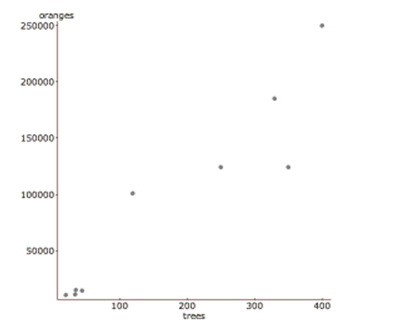
A study examined the number of trees in a variety of orange groves and the corresponding number of oranges that each grove produces in a given harvest year. Linear regression was calculated and the results are below.
linear regression results:
Dependent Variable: oranges
Independent Variable: trees Sample size: 9
R-sq = 0.886 s = 31394.7
Parameter Estimate Std. Err. Constant 390.59 16328.8 Trees 525.84 71.22
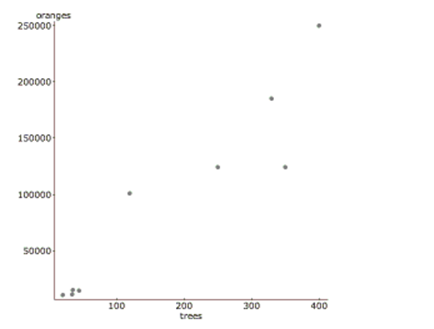 -Is the farmer in problem #5 pleased or displeased with the value of his residual? Why?
Free
(Essay)
4.9/5  (37)
(37)
Correct Answer: Verified
He would be displeased because his grove produced 3395 fewer oranges than predicted for a grove of his size.
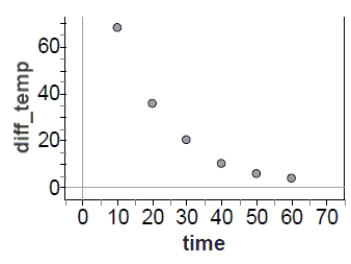
During a science lab, students heated water, allowed it to cool, and recorded the temperature over time. They computed the difference between the water temperature and the room temperature. The results are in the table.
Time (in minutes) 10 20 30 40 50 60 Difference in temp. (degrees F) 68 36 20 10 6 4
-Sketch a scatterplot. 
Free
(Essay)
4.7/5 (28)
Correct Answer:Verified
Which of the following is not a goal of re-expressing data?
Free
(Multiple Choice)
4.7/5 (28)
Correct Answer:Verified
D
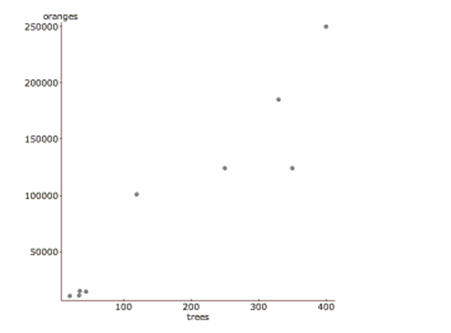
A study examined the number of trees in a variety of orange groves and the corresponding number of oranges that each grove produces in a given harvest year. Linear regression was calculated and the results are below.
linear regression results:
Dependent Variable:
oranges
Independent Variable: trees
Sample size: 9
R-sq = 0.886 s = 31394.7
Parameter Estimate Std. Err. Constant 390.59 16328.8 Trees 525.84 71.22
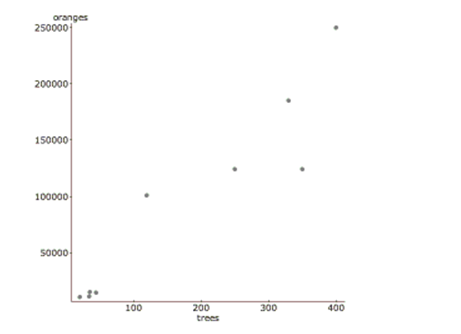 -Write the regression equation. Define all variables used in your equation.
(Essay)
4.9/5 (43)
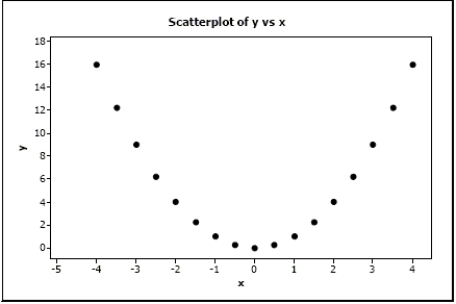
The following scatterplot shows a relationship between x and y that results in a correlation coefficient of r = 0. Explain why r = 0 in this situation even though there appears to be a strong relationship between the x and y variables.
(Essay)
4.8/5 (33)
An article in the Journal of Statistics Education reported the price of diamonds of different sizes in Singapore dollars
(SGD). The following table contains a data set that is consistent with this data, adjusted to US dollars in 2004:
2004 US S Carat 494.82 0.12 768.03 0.17 1105.03 0.20 1508.88 0.25 1826.18 0.28 2096.89 0.33 2004 US S Carat 688.24 0.15 944.90 0.18 1071.75 0.21 1504.44 0.26 1908.28 0.29 2409.76 0.35 2004 US S Carat 748.10 0.16 1076.18 0.19 1289.20 0.23 1597.63 0.27 2038.09 0.32
-Explain the meaning of R2 in the context of this problem.
(Essay)
4.8/5 (26)
During a science lab, students heated water, allowed it to cool, and recorded the temperature over time. They computed the difference between the water temperature and the room temperature. The results are in the table.
Time (in minutes) 10 20 30 40 50 60 Difference in temp. (degrees F) 68 36 20 10 6 4
-Newton's Law of Cooling suggests an exponential function is appropriate. Re-express the data using logarithms and sketch a new scatterplot.
(Essay)
4.8/5 (25)
The auto insurance industry crashed some test vehicles into a cement barrier at speeds of 5 to 25 mph to investigate the amount of damage to the cars. They found a correlation of r = 0.60 between speed (MPH) and damage ($). If the speed at which a car hit the barrier is 1.5 standard deviations above the mean speed, we expect the damage to be_______ the mean damage.
(Multiple Choice)
4.8/5 (35)
Halloween is a fun night. It seems that older children might get more candy because they can travel further while
trick-or-treating. But perhaps the youngest kids get extra candy because they are so cute. Here are some data that examine
this question, along with the regression output.
Dependent Variable: candy
Sample size: 9
(correlation coefficient)
Parameter Estimate Std. Err. Intercept 29.767327 12.21138 Age 0.88861386 1.6862229
 -The next day, a young girl reveals that her older brother also went trick-or-treating, but didn't want to admit that he participated. He was added to the data set and these are the results.
Dependent Variable: candy
Sample size: 10
(correlation coefficient
Parameter Estimate Std. Err. Intercept 13.569231 9.0783516 Age 3.4038462 1.0175376
-The next day, a young girl reveals that her older brother also went trick-or-treating, but didn't want to admit that he participated. He was added to the data set and these are the results.
Dependent Variable: candy
Sample size: 10
(correlation coefficient
Parameter Estimate Std. Err. Intercept 13.569231 9.0783516 Age 3.4038462 1.0175376
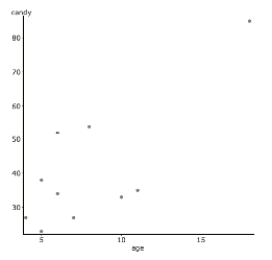 Describe the effect of this new candy collector on the regression model.
(Essay)
4.9/5 (33)
Associations For each pair of variables, indicate what association you expect: positive linear(+), negative linear(-), curved(C), or none(N).
a. the number of hours in the sun; the number of mold cultures on a piece of bread
b. the number of hours a store is open; the number of sales the store has
c. the number of hours you practice golf; your golf score
_ d. the price of gasoline; the number of families that take summer road trips
e. the size of a front lawn; the number of children who live in the house
(Short Answer)
5.0/5 (34)
Although there are annual ups and downs, over the long run, growth in the stock market averages about 9% per year. A model that best describes the value of a stock portfolio is probably:
(Multiple Choice)
4.9/5 (31)
Which of the following is not a source of caution in regression analysis between two variables?
(Multiple Choice)
4.9/5 (40)
Time Wasted A group of students decide to see if there is link between wasting time on the internet and GPA. They don't expect to find an extremely strong association, but they're hoping for at least a weak relationship. Here are the findings.
linear regression results: Dependent Variable: GPA Sample size: 10 R (correlation coefficient) =-0.37199274 R-sq =0.1383786 =0.85365134 Parameter Estimate Std. Err. Intercep t 4.06191 0.74405 Hours/week -0.0297 0.02616
a. How strong is the relationship the students found? Describe in context with statistical justification.
One student is concerned that the relationship is so weak, there may not actually be any relationship at all. To test this concern, he runs a simulation where the 10 GPA's are randomly matched with the 10 hours/week. After each random assignment, the correlation is calculated. This process is repeated 100 times. Here is a histogram of the 100 correlations. The correlation coefficient of -0.371 is indicated with a vertical line. 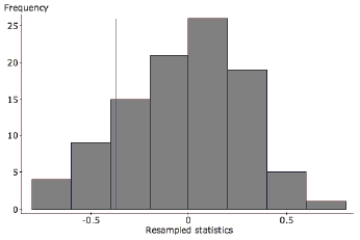 b. Do the results of this simulation confirm the suspicion that there may not be any relationship? Refer specifically to the graph in your explanation.
(Essay)
4.9/5 (30)
Breaking strength A company manufactures polypropylene rope in six different sizes. To assess the strength of the ropes they test two samples of each size to see how much force (in kilograms) the ropes will hold without breaking. The table shows the results of the tests. We want to create a model for predicting the breaking strength from the diameter of the rope.
Diameter () Strength () 4 60\mid76 7 157\mid153 10 254\mid262 12 334\mid388 15 551\mid529 20 938\mid893
a. Find a model that uses re-expressed data to straighten the scatterplot.
b. The company is thinking of introducing a new 25mm rope. How strong should it be?
(Write a sentence in context based on one of your models.)
(Essay)
4.7/5 (36)
A study examined the number of trees in a variety of orange groves and the corresponding number of oranges that each grove produces in a given harvest year. Linear regression was calculated and the results are below.
linear regression results:
Dependent Variable: oranges
Independent Variable: trees
Sample size: 9
R-sq = 0.886 s = 31394.7
Parameter Estimate Std. Err. Constant 390.59 16328.8 Trees 525.84 71.22
 -Interpret s in context.
(Essay)
4.8/5 (34)
A regression model examining the amount of distance a long distance runner runs (in miles) to predict the amount of fluid the runner drinks (ounces) has a slope of 4.6. Which interpretation is appropriate?
(Multiple Choice)
4.9/5 (40)
The average movie ticket prices in selected years since 1948 are listed in the table below.
Year Movie Ticket Price 1948 \ 0.36 1954 \ 0.49 1958 \ 0.68 1963 \ 0.86 1967 \ 1.22 1971 \ 1.65 1974 \ 1.89 1974 \ 2.03 1976 \ 2.13 1977 \ 2.23 1978 \ 2.34 1979 \ 2.47 1980 \ 2.69 1981 \ 2.78 1982 \ 2.94 1983 \ 3.15 1984 \ 3.36 1985 \ 3.55 1986 \ 3.71 1987 \ 3.91 1988 \ 4.11
a. Use re-expressed data to create a model that predicts ticket prices. (Hint: scale the year)
b. Find the movie ticket price this model predicts for 2004.
(Essay)
4.9/5 (28)
A study examined the number of trees in a variety of orange groves and the corresponding number of oranges that each grove produces in a given harvest year. Linear regression was calculated and the results are below.
linear regression results:
Dependent Variable: oranges
Independent Variable: trees
Sample size: 9
R-sq = 0.886 s = 31394.7
Parameter Estimate Std. Err. Constant 390.59 16328.8 Trees 525.84 71.22
 -Interpret the slope in context.
(Essay)
4.9/5 (41)
doing homework found . Which of these is true?
I. 32% of student test scores can be correctly predicted with this model.
II. Homework accounts for 32% of your grade in AP* Stats.
III. There's a 32% chance that you'll get the score this model predicts for you.
(Multiple Choice)
4.8/5 (29)
On the axes below, sketch a scatterplot describing...
a. a strong positive association
b. a weak negative association 
(Essay)
4.9/5 (29)
Filters
- Essay(0)
- Multiple Choice(0)
- Short Answer(0)
- True False(0)
- Matching(0)