Exam 1: Stats Start Here
Exam 1: Stats Start Here115 Questions
Exam 2: Data150 Questions
Exam 3: Displaying and Describing Categorical Data110 Questions
Exam 4: Displaying and Comparing Qualitative Data84 Questions
Exam 5: Understanding and Comparing Distributions103 Questions
Exam 6: The Standard Deviation As a Ruler and the Normal Model74 Questions
Exam 7: Scatterplots, Association, and Correlation40 Questions
Select questions type
Two sections of a class took the same quiz. Section A had 15 students who had a mean score of 80, and Section B had 20 students who had a mean score of 90. Overall, what was the approximate mean score for all of the students on the quiz?
Free
(Multiple Choice)
4.7/5  (33)
(33)
Correct Answer: Verified
A
While the scales histograms are the same, there is something that could be improved so that we could compare these two distributions better. Identify this improvement and explain why it would be better.
Free
(Essay)
4.9/5 (30)
Correct Answer:Verified
The frequency scales are not the same for the two histograms. If we converted each of the frequency histograms to a relative frequency histogram, we would be better able to compare the frequencies for each distribution at the heights.
On Monday, a class of students took a big test, and the highest score was 92. The next day,
a student who had been absent made up the test, scoring 100. Indicate whether adding that
student's score to the rest of the data made each of these summary statistics increase, decrease, or stay about the same:
a. mean
b. median
c. range d. IQR
e. standard deviation
Free
(Short Answer)
4.9/5 (42)
Correct Answer:Verified
a. mean: increase
b. median: stay about the same
c. range: increase
d. IQR: stay about the same
e. standard deviation: increase
In order to plan transportation and parking needs at a private high school, administrators asked students how they get to school. Some rode a school bus, some rode in with parents or friends, and others used "personal" transportation - bikes, skateboards, or just walked. The table summarizes the responses from boys and girls.
Male Female Total Bus 30 34 Ride 37 45 Personal 19 23 Total
-What is the marginal distribution of gender?
(Short Answer)
4.8/5 (36)
Suppose that a Normal model describes the acidity (pH) of rainwater, and that water tested after last week's storm had a z-score of 1.8. This means that the acidity of that rain…
(Multiple Choice)
4.9/5 (35)
There are 18 roller coasters in Virginia for which the lengths (in feet) were reported. Those lengths are listed in the table at the right.
1385 2757 2835 2231 3828 1312 3369 3240 5100 3157 2700 600
a. Sketch a histogram for these data.
b. Find the mean and standard deviation of the roller coaster lengths.
c. Is it appropriate to use the mean and standard deviation to summarize these data?
Explain.
d. Describe the distribution of roller coaster lengths.
(Essay)
4.8/5 (33)
The side-by-side boxplots show the cumulative college GPAs for sophomores, juniors, and seniors taking an intro stats course in Autumn 2003. 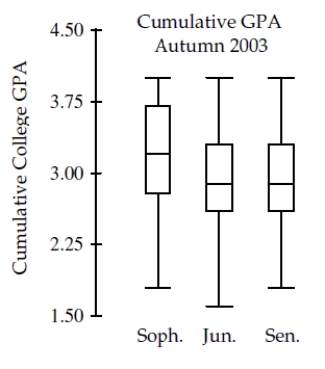 a. Which class (sophomore, junior, or senior) had the lowest cumulative college GPA? What is the approximate value of that GPA?
b. Which class had the highest median GPA, and what is that GPA?
c. Which class had the largest range for GPA, and what is it?
d. Which class had the most symmetric set of GPAs? The most skewed set of GPAs?
a. Which class (sophomore, junior, or senior) had the lowest cumulative college GPA? What is the approximate value of that GPA?
b. Which class had the highest median GPA, and what is that GPA?
c. Which class had the largest range for GPA, and what is it?
d. Which class had the most symmetric set of GPAs? The most skewed set of GPAs?
(Essay)
5.0/5 (39)
If we want to discuss any gaps and clusters in a data set, which of the following should not be chosen to display the data set?
(Multiple Choice)
4.7/5 (37)
In June 2003 Consumer Reports published an article on some sport-utility vehicles they had tested recently. They reported some basic information about each of the vehicles and the results of some tests conducted by their staff. Among other things, the article told the brand of each vehicle, its price, and whether it had a standard or automatic transmission. They reported the vehicle's fuel economy, its acceleration (number of seconds to go from zero to 60 mph), and its braking distance to stop from 60 mph. The article also rated each vehicle’s reliability as much better than average, better than average, average, worse, or much worse than average.
-Describe the W's, if the information is given:
· Who:
· What:
· When:
· Where:
· How:
· Why:
(Essay)
4.7/5 (31)
The United States Census collects data on many variables about individuals and households.
Which variable is categorical?
(Multiple Choice)
4.9/5 (36)
Nickels minted in the United States are supposed to weigh 5.000 grams. Of course there is some variation in that. The actual weights are pretty well represented by a normal model with a mean of 5.000 g and a standard deviation of about 0.08 g. Draw and clearly label this model. 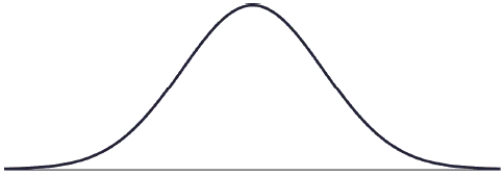
(Essay)
4.7/5 (44)
Students taking an intro stats class reported the number of credit hours that they were taking that quarter.Summary statistics are shown in the table.
16.65 s 2.96 min 5 Q1 15 median 16 Q3 19 max 28
a. Suppose that the college charges $73 per credit hour plus a flat student fee of $35 per quarter. For example, a student taking 12 credit hours would pay $35 + $73(12) = $911 for that quarter.
i. What is the mean fee paid?
ii. What is the standard deviation for the fees paid?
iii. What is the median fee paid?
iv. What is the IQR for the fees paid?
b. Twenty-eight credit hours seems like a lot. Would you consider 28 credit hours to be unusually high? Explain.
(Essay)
4.8/5 (30)
The veterinary bills for the dogs are summarized in the ogive below. Estimate the IQR of these expenses. 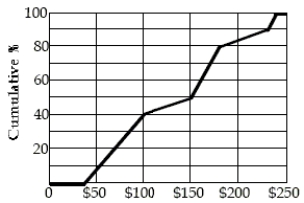
(Multiple Choice)
4.9/5 (40)
One of the reasons that the Monitoring the Future (MTF) project was started was "to study changes in the beliefs, attitudes, and behavior of young people in the United States." Data are collected from 8th, 10th, and 12th graders each year. To get a representative nationwide sample, surveys are given to a randomly selected group of students. In Spring 2004, students were asked about alcohol, illegal drug, and cigarette use. Describe the W's, if the information is given. If the information is not given, state that it is not specified.
· Who:
· What:
· When:
· Where:
· How:
· Why:
(Essay)
4.8/5 (38)
The best estimate of the standard deviation of the mens' weights displayed in this dotplot is 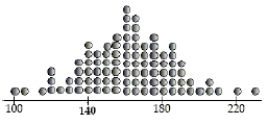
(Multiple Choice)
4.9/5 (28)
Soda cans A machine that fills cans with soda fills according to a Normal model with mean
12.1 ounces and standard deviation 0.05 ounces.
a. If the cans claim to have 12 ounces of soda each, what percent of cans are under-filled?
b. Management wants to ensure that only 1% of cans are under-filled.
i. Scenario 1: If the mean fill of the cans remains at 12.1 ounces, what standard deviation does the filling machine need to have to achieve this goal?
ii. Scenario 2: If the standard deviation is to remain at 0.05 ounces, what mean does the filling machine need to have to achieve this goal?
(Essay)
4.8/5 (31)
The standard deviation of the data displayed in this dotplot is most likely to be… 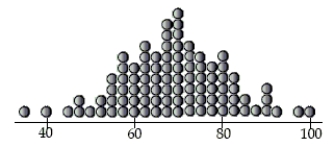
(Multiple Choice)
4.7/5 (37)
Repair bills An automobile service shop reported the summary statistics shown for repair bills (in $) for their customers last month.
Min 27 Q1 88 Median 132 Q3 308 Max 1442 Mean 284 SD 140
a. Were any of the bills outliers? Show how you made your decision.
b. After checking out a problem with your car the service manager gives you an estimate of
"only $90." Is he right to imply that your bill will be unusually low? Explain briefly.
(Essay)
4.8/5 (42)
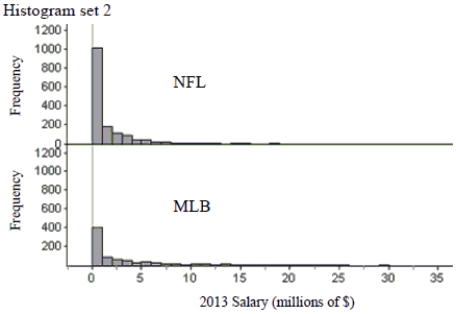
How do sports salaries compare? Two sets of histograms below show the distributions of salaries for Major League Baseball and the National Football League. Give two reasons
why the second set of histograms makes it easier to compare the distributions. Then write a few sentences comparing the salary distributions for the two sports. 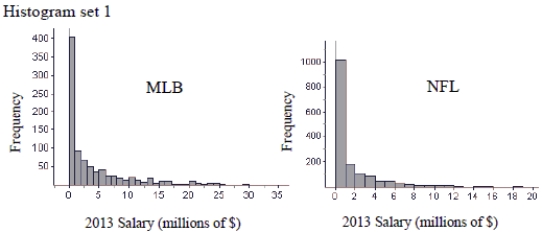
(Essay)
4.9/5 (36)
Filters
- Essay(0)
- Multiple Choice(0)
- Short Answer(0)
- True False(0)
- Matching(0)