Exam 10: Aggregate Supply
Exam 1: The Art and Science of Economic Analysis150 Questions
Exam 2: Some Tools of Economic Analysis157 Questions
Exam 3: Economic Decision Makers174 Questions
Exam 4: Demand, Supply, and Markets151 Questions
Exam 5: Introduction to Macroeconomics151 Questions
Exam 6: Tracking the U S Economy149 Questions
Exam 7: Unemployment and Inflation150 Questions
Exam 8: Us Productivity and Growth150 Questions
Exam 9: Aggregate Demand150 Questions
Exam 10: Aggregate Supply150 Questions
Exam 11: Fiscal Policy151 Questions
Exam 12: Federal Budgets and Public Policy153 Questions
Exam 13: Money and the Financial System150 Questions
Exam 14: Banking and the Money Supply150 Questions
Exam 15: Monetary Theory and Policy150 Questions
Exam 16: The Policy Debate: Active or Passive150 Questions
Exam 17: International Trade150 Questions
Exam 18: International Finance150 Questions
Exam 19: Economic Development150 Questions
Select questions type
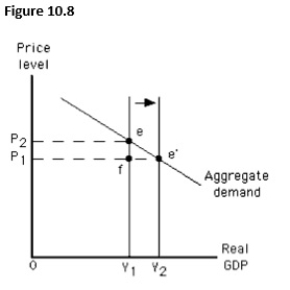
The figure given below depicts long run equilibrium in an aggregate demand-aggregate supply model.Which of the following is indicated by the arrow given in this figure?
(Multiple Choice)
4.9/5  (48)
(48)
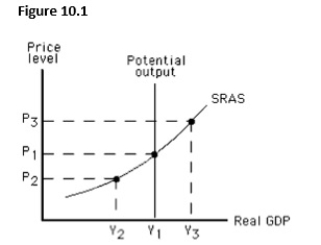
The figure below shows the short-run aggregate supply curve of an economy.In this figure,a recessionary gap would be represented by the distance between:
(Multiple Choice)
4.8/5 (34)
If resource prices are flexible,the long-run aggregate supply curve is vertical.
(True/False)
4.9/5 (38)
Which of the following is generally true of nominal wages?
(Multiple Choice)
4.8/5 (35)
Suppose the price level increases by 5 percent and the nominal wages of workers increase by 3 percent during a particular year.This implies that the real wage has:
(Multiple Choice)
4.9/5 (45)
An increase in the federal minimum wage will shift the long-run aggregate supply curve to the left.
(True/False)
4.8/5 (35)
An expansionary gap generally creates inflationary pressure in an economy.
(True/False)
4.9/5 (36)
Which of the following supply shocks will shift the long-run aggregate supply curve outward?
(Multiple Choice)
4.8/5 (40)
Consider schedule #1 in the aggregate demand and aggregate supply table given below.The equilibrium output and price level for the economy described on this schedule are:
?
Table 10.1
?
?
Quantity of Aggregate Output Demanded Price Level \#1 Quantity of Aggregate Output Supplied \#2 \#3 \ 7.0 110 \ 5.0 \ 6.0 \ 4.0 6.5 120 5.5 6.5 4.5 6.0 130 6.0 7.0 5.0 5.5 140 6.5 7.5 5.5 5.0 150 7.0 8.0 6.0
?
(Multiple Choice)
4.9/5 (45)
Filters
- Essay(0)
- Multiple Choice(0)
- Short Answer(0)
- True False(0)
- Matching(0)