Multiple Choice
The figure below shows the short-run aggregate supply curve of an economy.In this figure,a recessionary gap would be represented by the distance between: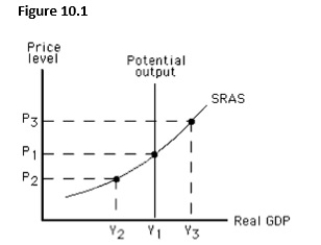
A) Y1and Y2.
B) Y1and Y3.
C) Y2and Y3.
D) P3and P1.
E) P3and P2.
Correct Answer:

Verified
Correct Answer:
Verified
Related Questions
Q137: Which of these is true of the
Q138: Which of the following is true in
Q139: The figure below shows the short-run aggregate
Q140: A failure in coordination between workers and
Q141: The figure given below depicts long run
Q143: If resource prices are flexible,the long-run aggregate
Q144: Which of the following is generally true
Q145: The main effect of an increase in
Q146: Suppose the price level increases by 5
Q147: An increase in the federal minimum wage