Multiple Choice
The figure given below depicts long run equilibrium in an aggregate demand-aggregate supply model.Which of the following is indicated by the arrow given in this figure?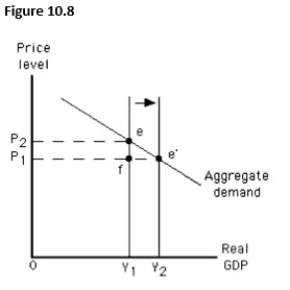
A) A decrease in capital stock
B) An increase in long-run aggregate supply
C) An increase in nominal wage
D) A decrease in long-run aggregate supply
E) A decrease in the aggregate quantity demanded
Correct Answer:

Verified
Correct Answer:
Verified
Q136: If the actual price level is higher
Q137: Which of these is true of the
Q138: Which of the following is true in
Q139: The figure below shows the short-run aggregate
Q140: A failure in coordination between workers and
Q142: The figure below shows the short-run aggregate
Q143: If resource prices are flexible,the long-run aggregate
Q144: Which of the following is generally true
Q145: The main effect of an increase in
Q146: Suppose the price level increases by 5