Exam 5: Elasticity and Its Application
Exam 1: Ten Principles of Economics387 Questions
Exam 2: Thinking Like an Economist569 Questions
Exam 3: Interdependence and the Gains From Trade463 Questions
Exam 4: The Market Forces of Supply and Demand606 Questions
Exam 5: Elasticity and Its Application524 Questions
Exam 6: Supply,demand,and Government Policies593 Questions
Exam 7: Consumers,producers,and the Efficiency of Markets496 Questions
Exam 8: Application: The Costs of Taxation453 Questions
Exam 9: Application: International Trade441 Questions
Exam 10: Externalities473 Questions
Exam 11: Public Goods and Common Resources388 Questions
Exam 12: The Design of the Tax System499 Questions
Exam 13: The Costs of Production507 Questions
Exam 14: Firms in Competitive Markets502 Questions
Exam 15: Monopoly541 Questions
Exam 16: Monopolistic Competition521 Questions
Exam 17: Oligopoly428 Questions
Exam 18: The Market for the Factors of Production477 Questions
Exam 19: Earnings and Discrimination425 Questions
Exam 20: Income Inequality and Poverty399 Questions
Exam 21: The Theory of Consumer Choice492 Questions
Exam 22: Frontiers of Microeconomics380 Questions
Exam 23: Measuring a Nations Income464 Questions
Exam 24: Measuring the Cost of Living452 Questions
Exam 25: Production and Growth457 Questions
Exam 26: Saving,investment,and the Financial System502 Questions
Exam 27: The Basic Tools of Finance461 Questions
Exam 28: Unemployment610 Questions
Exam 29: The Monetary System461 Questions
Exam 30: Money Growth and Inflation427 Questions
Exam 31: Open-Economy Macroeconomic Models488 Questions
Exam 32: A Macroeconomic Theory of the Open Economy404 Questions
Exam 33: Aggregate Demand and Aggregate Supply511 Questions
Exam 34: The Influence of Monetary and Fiscal Policy on Aggregate Demand451 Questions
Exam 35: The Short-Run Trade-Off Between Inflation and Unemployment415 Questions
Exam 36: Six Debates Over Macroeconomic Policy273 Questions
Select questions type
If the income elasticity of demand for a good is negative,then the good must be an inferior good.
(True/False)
4.8/5  (34)
(34)
Which of the following could be the price elasticity of demand for a good for which an increase in price would increase revenue?
(Multiple Choice)
5.0/5 (43)
Figure 5-17 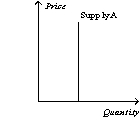
 -Refer to Figure 5-17.Which of the following statements is correct?
(Multiple Choice)
4.8/5 (53)
Fiona's Fish Emporium increased its total monthly revenue from $1,500 to $1,800 when it raised the price of tropical fish from $5 to $9.The price elasticity of demand for Fiona's Fish Emporium is
(Multiple Choice)
4.9/5 (36)
Which of the following is likely to have the most price inelastic demand?
(Multiple Choice)
4.9/5 (40)
Figure 5-1 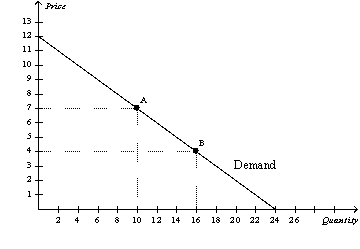 -Refer to Figure 5-1.Between point A and point B,price elasticity of demand using the midpoint method is equal to
(Multiple Choice)
4.8/5 (29)
Figure 5-5 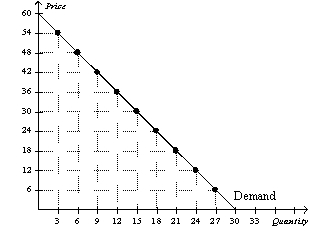 -Refer to Figure 5-5.At a price of $12 per unit,sellers' total revenue equals
(Multiple Choice)
4.9/5 (30)
Figure 5-14 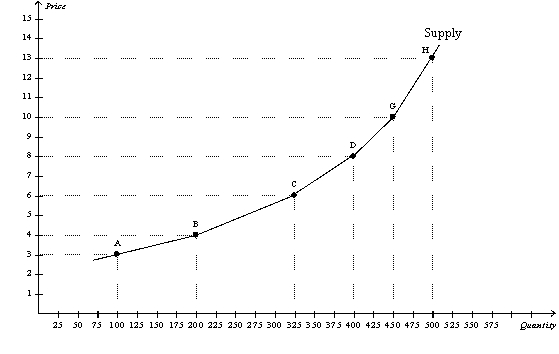 -Refer to Figure 5-14.Along which of these segments of the supply curve is supply least elastic?
(Multiple Choice)
4.7/5 (31)
Moving downward and to the right along a linear demand curve,we know that total revenue
(Multiple Choice)
4.7/5 (41)
Figure 5-6 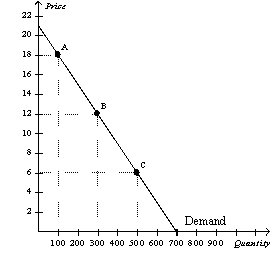 -Refer to Figure 5-6.Using the midpoint method,the price elasticity of demand between point B and point C is
(Multiple Choice)
4.8/5 (30)
Table 5-2
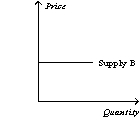
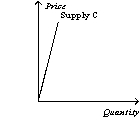
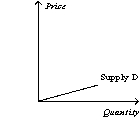
 -Refer to Table 5-2.Using the midpoint method,which of the three supply curves has the most elastic price elasticity of supply?
(Multiple Choice)
4.9/5 (40)
Frequently,in the short run,the quantity supplied of a good is
(Multiple Choice)
5.0/5 (33)
Studies indicate that the price elasticity of demand for cigarettes is about 0.4.A government policy aimed at reducing smoking changed the price of a pack of cigarettes from $2 to $6.According to the midpoint method,the government policy should have reduced smoking by
(Multiple Choice)
4.9/5 (36)
Holding all other forces constant,when the price of gasoline rises,the number of gallons of gasoline demanded would fall substantially over a ten-year period because
(Multiple Choice)
4.8/5 (41)
Suppose that good X is a luxury and that good Y is a necessity.Which good would you expect to have more price elastic demand?
(Short Answer)
4.8/5 (37)
When the price of a good is $5,the quantity demanded is 100 units per month;when the price is $7,the quantity demanded is 80 units per month.Using the midpoint method,the price elasticity of demand is about
(Multiple Choice)
4.9/5 (27)
Which of the following is likely to have the most price inelastic demand?
(Multiple Choice)
5.0/5 (31)
Figure 5-4 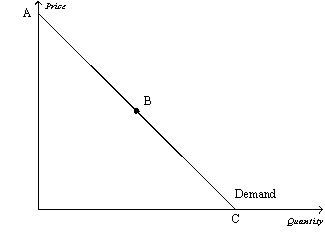 -Refer to Figure 5-4.Assume,for the good in question,two specific points on the demand curve are (Q = 1,000,P = $40)and (Q = 1,500,P = $30).Then which of the following scenarios is possible?
(Multiple Choice)
4.8/5 (36)
For a particular good,a 2 percent increase in price causes a 12 percent decrease in quantity demanded.Which of the following statements is most likely applicable to this good?
(Multiple Choice)
4.8/5 (26)
Filters
- Essay(0)
- Multiple Choice(0)
- Short Answer(0)
- True False(0)
- Matching(0)