Exam 13: Business Fluctuations: Aggregate Demand and Supply
Exam 1: The Big Ideas253 Questions
Exam 2: The Power of Trade and Comparative Advantage262 Questions
Exam 3: Supply and Demand255 Questions
Exam 4: Equilibrium: How Supply and Demand Determine Prices265 Questions
Exam 5: Price Ceilings and Floors325 Questions
Exam 6: GDP and the Measurement of Progress329 Questions
Exam 7: The Wealth of Nations and Economic Growth280 Questions
Exam 8: Growth, Capital Accumulation and the Economics of Ideas: Catching up Vs the Cutting Edge295 Questions
Exam 9: Saving, Investment, and the Financial System312 Questions
Exam 10: Stock Markets and Personal Finance275 Questions
Exam 11: Unemployment and Labor Force Participation259 Questions
Exam 12: Inflation and the Quantity Theory of Money289 Questions
Exam 13: Business Fluctuations: Aggregate Demand and Supply337 Questions
Exam 14: Transmission and Amplification Mechanisms221 Questions
Exam 15: The Federal Reserve System and Open Market Operations313 Questions
Exam 16: Monetary Policy266 Questions
Exam 17: The Federal Budget: Taxes and Spending281 Questions
Exam 18: Fiscal Policy273 Questions
Exam 19: International Trade195 Questions
Exam 20: International Finance307 Questions
Exam 21: Political Economy and Public Choice306 Questions
Select questions type
Use the following to answer questions: Figure: Oil Market Diagrams 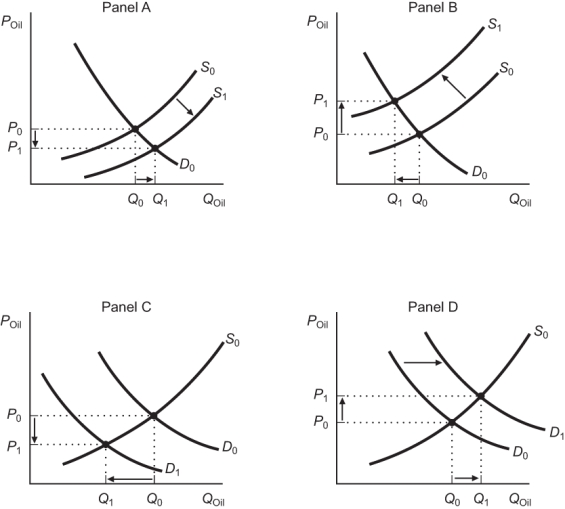 -(Figure: Oil Market Diagrams) Consider the world oil market diagrams presented in the figure. Which of the panels correctly depicts what happened in the market for oil during the 1973 OPEC oil crisis?
(Multiple Choice)
4.8/5  (39)
(39)
A decrease in the supply of oil makes capital and labor less productive.
(True/False)
4.9/5 (39)
An increase in expected inflation will cause the economy's aggregate demand curve to:
(Multiple Choice)
4.8/5 (37)
The long-run aggregate supply curve shows that inflation has no impact on real long-term growth.
(True/False)
4.9/5 (45)
Which of the following explains why the inflation rate is slow to adjust over time?
(Multiple Choice)
4.9/5 (39)
According to the AD-AS model, demand shocks affect real GDP growth while real shocks do not affect real GDP growth.
(True/False)
4.8/5 (37)
A positive real shock causes the aggregate demand curve to:
(Multiple Choice)
4.8/5 (38)
In the graph of the AD-AS model, what is measured on the vertical axis?
(Multiple Choice)
4.9/5 (42)
Sticky wages and prices are incorporated in the AD-AS model by the:
(Multiple Choice)
4.8/5 (35)
Answer the following three questions about the Great Depression.
A) What were the four major shocks that contributed to the Great Depression?
B) Using a graph, show how these shocks affected AD.
C) Did the monetary authorities have a hand in causing and/or exacerbating the Great Depression? Explain.
(Essay)
4.7/5 (45)
In 1970, 1.3 barrels of oil produced $1,000 of GDP. In 2004, it took only 0.64 barrels of oil. What implications does this have for economic fluctuations in the United States today?
(Multiple Choice)
4.9/5 (38)
The following question has three parts, which are to be answered independently of each other. Graphically show your response to the following shocks in the AD-AS model:
A) If a new round of consumer pessimism abounds, what would happen to the economy's short-run growth rate?
B) If there is a positive, but temporary, monetary shock, what would happen to the economy's short-run growth rate?
C) If a country's imports temporarily increase, but exports stay the same, what would happen to the economy's short-run growth rate?
(Essay)
4.8/5 (36)
Approximately what percentage of banks failed between 1930 and 1932?
(Multiple Choice)
4.8/5 (34)
What happened to the U.S. money supply during the early years of the Great Depression?
(Essay)
4.9/5 (35)
Productivity in an agricultural economy could be significantly affected by:
(Multiple Choice)
4.9/5 (42)
Filters
- Essay(0)
- Multiple Choice(0)
- Short Answer(0)
- True False(0)
- Matching(0)