Exam 13: Business Fluctuations: Aggregate Demand and Supply
Exam 1: The Big Ideas253 Questions
Exam 2: The Power of Trade and Comparative Advantage262 Questions
Exam 3: Supply and Demand255 Questions
Exam 4: Equilibrium: How Supply and Demand Determine Prices265 Questions
Exam 5: Price Ceilings and Floors325 Questions
Exam 6: GDP and the Measurement of Progress329 Questions
Exam 7: The Wealth of Nations and Economic Growth280 Questions
Exam 8: Growth, Capital Accumulation and the Economics of Ideas: Catching up Vs the Cutting Edge295 Questions
Exam 9: Saving, Investment, and the Financial System312 Questions
Exam 10: Stock Markets and Personal Finance275 Questions
Exam 11: Unemployment and Labor Force Participation259 Questions
Exam 12: Inflation and the Quantity Theory of Money289 Questions
Exam 13: Business Fluctuations: Aggregate Demand and Supply337 Questions
Exam 14: Transmission and Amplification Mechanisms221 Questions
Exam 15: The Federal Reserve System and Open Market Operations313 Questions
Exam 16: Monetary Policy266 Questions
Exam 17: The Federal Budget: Taxes and Spending281 Questions
Exam 18: Fiscal Policy273 Questions
Exam 19: International Trade195 Questions
Exam 20: International Finance307 Questions
Exam 21: Political Economy and Public Choice306 Questions
Select questions type
According to the quantity theory of money, an increase in money supply causes an increase in:
(Multiple Choice)
4.9/5  (42)
(42)
If spending in an economy increases by 3% and real GDP increases by 1%, the result will be:
(Multiple Choice)
4.8/5 (36)
Using an AD-AS model, graphically depict an economy operating in a boom and explain what will happen to this economy in the long run.
(Essay)
5.0/5 (42)
The average annual rate of growth of real GDP in the United States has fluctuated around ____ for the last 60 years.
(Multiple Choice)
4.8/5 (33)
Expected shocks are more difficult to deal with than unexpected shocks.
(True/False)
4.8/5 (36)
In a diagram with the inflation rate on the vertical axis and the real growth rate on the horizontal axis, the long-run aggregate supply curve is:
(Multiple Choice)
4.8/5 (36)
Large increases in oil prices are positive shocks to aggregate demand.
(True/False)
4.9/5 (29)
Based on the discussion in the textbook, the Great Depression was caused by:
(Multiple Choice)
4.7/5 (24)
An increase in consumer pessimism will lead to increased inflation in:
(Multiple Choice)
4.8/5 (35)
For any given expected inflation rate, the short-run aggregate supply curve shows the relationship between:
(Multiple Choice)
4.8/5 (36)
Use the following to answer questions: Figure: Long-Run Aggregate Supply Curves 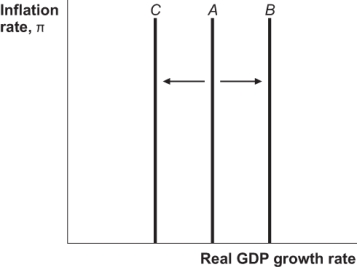 -(Figure: Long-Run Aggregate Supply Curves) Which of the following can explain the shift of the long-run aggregate supply curve from A to C in the figure?
(Multiple Choice)
4.8/5 (41)
If nominal spending growth equals 6% and the real growth rate equals 4%, what is the inflation rate?
(Multiple Choice)
4.7/5 (49)
If spending grows by 3%, real GDP grows by 5%, and velocity is stable, then prices will be _____ at a rate of _____ according to the aggregate demand curve.
(Multiple Choice)
4.7/5 (32)
Filters
- Essay(0)
- Multiple Choice(0)
- Short Answer(0)
- True False(0)
- Matching(0)