Exam 1: The Scope and Method of Economics
Exam 1: The Scope and Method of Economics68 Questions
Exam 2: The Economic Problem: Scarcity and Choice50 Questions
Exam 3: Demand, Supply, and Market Equilibrium52 Questions
Exam 4: Demand and Supply Applications41 Questions
Exam 5: Elasticity74 Questions
Exam 6: Household Behavior and Consumer Choice50 Questions
Exam 7: The Production Process: the Behavior of Profit-Maximizing Firms64 Questions
Exam 8: Short-Run Costs and Output Decisions59 Questions
Exam 9: Long-Run Costs and Output Decisions87 Questions
Exam 10: Input Demand: the Labor and Land Markets77 Questions
Exam 11: Input Demand: the Capital Market and the Investment Decision66 Questions
Exam 12: General Equilibrium and the Efficiency of Perfect Competition44 Questions
Exam 13: Monopoly and Antitrust Policy45 Questions
Exam 14: Oligopoly53 Questions
Exam 15: Monopolistic Competition31 Questions
Exam 16: Externalities, Public Goods, and Social Choice54 Questions
Select questions type
Graph the relationship between variables X and Y according to the table below: 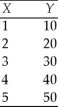
(Essay)
4.9/5  (35)
(35)
If crime rates in the United States fall, can incumbent lawmakers rightfully claim credit? Why or why not?
(Essay)
4.8/5 (32)
What branch of economics involves the collection and use of data to test economic theories? Why is this task often more difficult in economics than it is in physical sciences?
(Essay)
4.8/5 (36)
Draw a graph showing a line with a positive slope. Draw a graph showing a line with a negative slope. Explain what the shape of these lines implies about the relationship between the variable on the x-axis and the variable on the y-axis?
(Essay)
4.7/5 (42)
Assume that you have heard news that a local radio station is hosting a luncheon at your school by offering hot dogs, chips and cola at no expense to the student body. Why would economists say that this lunch is not truly free?
(Essay)
4.9/5 (45)
List the four criteria that are generally used to evaluate economic outcomes.
(Essay)
4.9/5 (37)
Explain how and why an all-volunteer army may actually be cheaper than an army staffed with drafted soldiers.
(Essay)
4.7/5 (35)
Explain the difference between economic growth and stability. Can a country experience both at the same time? Why or why not?
(Essay)
4.8/5 (32)
Michelle's Secretarial Services rents a copying machine for $50 per month plus a per copy charge of $0.10 per copy. Draw a diagram showing the relationship between the number of copies made and the firm's monthly copying bill. What is the slope of the line drawn? If the firm makes 5,000 copies in one month, what will be the bill for copying?
(Essay)
4.7/5 (31)
Give an example of a positive economic statement and a normative economic statement.
(Essay)
4.8/5 (36)
The following equation describes the relationship between the price of scanners (P) and the quantity that buyers will purchase each week (Q):
Q = 300 - 2P.
The following equation describes the relationship between the price of scanners (P) and the quantity that sellers will sell each week (Q):
Q = 3P.
On a graph (with Q on the horizontal axis and P on the vertical axis), plot the two equations using the following values for P: $30, $40, $50, $60, and $70. At what price do the two curves intersect? What is the quantity of scanners at this point?
(Essay)
4.9/5 (37)
Filters
- Essay(0)
- Multiple Choice(0)
- Short Answer(0)
- True False(0)
- Matching(0)