Exam 1: The Scope and Method of Economics
Exam 1: The Scope and Method of Economics68 Questions
Exam 2: The Economic Problem: Scarcity and Choice50 Questions
Exam 3: Demand, Supply, and Market Equilibrium52 Questions
Exam 4: Demand and Supply Applications41 Questions
Exam 5: Elasticity74 Questions
Exam 6: Household Behavior and Consumer Choice50 Questions
Exam 7: The Production Process: the Behavior of Profit-Maximizing Firms64 Questions
Exam 8: Short-Run Costs and Output Decisions59 Questions
Exam 9: Long-Run Costs and Output Decisions87 Questions
Exam 10: Input Demand: the Labor and Land Markets77 Questions
Exam 11: Input Demand: the Capital Market and the Investment Decision66 Questions
Exam 12: General Equilibrium and the Efficiency of Perfect Competition44 Questions
Exam 13: Monopoly and Antitrust Policy45 Questions
Exam 14: Oligopoly53 Questions
Exam 15: Monopolistic Competition31 Questions
Exam 16: Externalities, Public Goods, and Social Choice54 Questions
Select questions type
The manager of a company has been told by his engineers and cost accountants that the marginal cost of producing additional electronic wafers is likely to remain constant at a $.50 each for the hundred thousand in production. Explain what the marginal cost function would look like and why. What is the slope of this cost function?
(Essay)
4.9/5  (40)
(40)
An engineer has informed the city manager that the marginal cost of an additional car crossing the city bridge is zero? If you were required to draw this cost function on a graph what would it look like? What is the slope of this graph?
(Essay)
4.8/5 (37)
In the figure below, is the slope positive or negative? Calculate the slope. 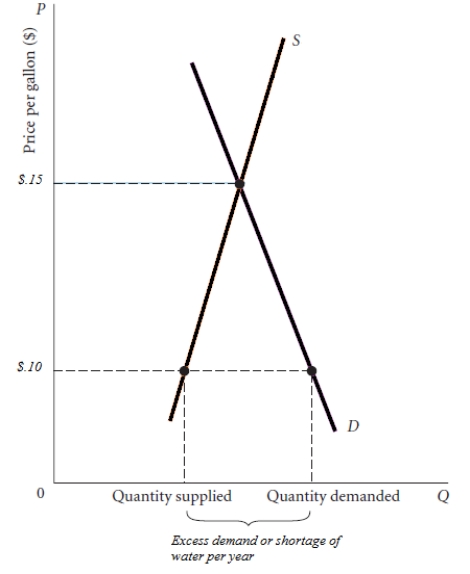
(Essay)
5.0/5 (37)
Explain how to calculate the slope of a line. What does the slope measure?
(Essay)
4.8/5 (37)
Assume that at very low tax rates the government collects a very modest amount of revenue from personal taxes. As the rate is raised the government collects more revenue but at a decreasing rate. Suppose furthermore that at some tax rate of let's say 30% the total amount of tax revenue is maximized. Any tax rate above that leads to a reduction in tax revenue collected. From this information and that contained in the table below graph the relationship between the tax rate and tax revenue with the tax rate on the horizontal axis and tax revenue on the vertical axis.
(Essay)
4.8/5 (36)
Filters
- Essay(0)
- Multiple Choice(0)
- Short Answer(0)
- True False(0)
- Matching(0)