Exam 10: Two-Sample Tests
Exam 1: Defining and Collecting Data204 Questions
Exam 2: Organizing and Visualizing Variables185 Questions
Exam 3: Numerical Descriptive Measures167 Questions
Exam 4: Basic Probability163 Questions
Exam 5: Discrete Probability Distributions216 Questions
Exam 6: The Normal Distribution and Other Continuous Distributions187 Questions
Exam 7: Sampling Distributions129 Questions
Exam 8: Confidence Interval Estimation189 Questions
Exam 9: Fundamentals of Hypothesis Testing: One-Sample Tests185 Questions
Exam 10: Two-Sample Tests212 Questions
Exam 11: Analysis of Variance210 Questions
Exam 12: Chi-Square and Nonparametric Tests175 Questions
Exam 13: Simple Linear Regression210 Questions
Exam 14: Introduction to Multiple Regression256 Questions
Exam 15: Multiple Regression Model Building67 Questions
Exam 16: Time-Series Forecasting168 Questions
Exam 17: Business Analytics113 Questions
Exam 18: A Roadmap for Analyzing Data325 Questions
Exam 19: Statistical Applications in Quality Management158 Questions
Exam 20: Decision Making123 Questions
Exam 21: Getting Started: Important Things to Learn First35 Questions
Exam 22: Binomial Distribution and Normal Approximation230 Questions
Select questions type
SCENARIO 10-3
A real estate company is interested in testing whether the mean time that families in Gotham have been living in their current homes is less than families in Metropolis.Assume that the two population variances are equal.A random sample of 100 families from Gotham and a random sample of 150 families in Metropolis yield the following data on length of residence in current homes. Gotham: x̄ G = 35 months,SG 2 = 900 Metropolis: x̄ M = 50 months,S M2 = 1050
-Referring to Scenario 10-3,what is the estimated standard error of the difference between the 2 sample means?
(Multiple Choice)
4.8/5  (34)
(34)
SCENARIO 10-11
The dean of a college is interested in the proportion of graduates from his college who have a job offer on graduation day.He is particularly interested in seeing if there is a difference in this proportion for accounting and economics majors.In a random sample of 100 of each type of major at graduation,he found that 65 accounting majors and 52 economics majors had job offers.If the accounting majors are designated as "Group 1" and the economics majors are designated as "Group 2," perform the appropriate hypothesis test using a level of significance of 0.05.
-Referring to Scenario 10-11,construct a 90% confidence interval estimate of the difference in proportion between accounting majors and economic majors who have a job offer on graduation day.
(Short Answer)
4.8/5 (34)
SCENARIO 10-3
A real estate company is interested in testing whether the mean time that families in Gotham have been living in their current homes is less than families in Metropolis.Assume that the two population variances are equal.A random sample of 100 families from Gotham and a random sample of 150 families in Metropolis yield the following data on length of residence in current homes. Gotham: x̄ G = 35 months,SG 2 = 900 Metropolis: x̄ M = 50 months,S M2 = 1050
-Referring to Scenario 10-3,what is the 95% confidence interval estimate for the difference in the two means?
(Short Answer)
4.8/5 (33)
SCENARIO 10-10
A corporation randomly selects 150 salespeople and finds that 66% who have never taken a self- improvement course would like such a course.The firm did a similar study 10 years ago in which 60% of a random sample of 160 salespeople wanted a self-improvement course.The groups are assumed to be independent random samples.Let 1 and 2 represent the true proportion of workers who would like to attend a self-improvement course in the recent study and the past study,respectively.
-Referring to Scenario 10-10,the company tests to determine at the 0.05 level whether the population proportion has changed from the previous study.Which of the following is correct?
(Multiple Choice)
4.7/5 (36)
SCENARIO 10-6
To investigate the efficacy of a diet,a random sample of 16 male patients is selected from a population of adult males using the diet.The weight of each individual in the sample is taken at the start of the diet and at a medical follow-up 4 weeks later.Assuming that the population of differences in weight before versus after the diet follow a normal distribution,the t-test for related samples can be used to determine if there was a significant decrease in the mean weight during this period.Suppose the mean decrease in weights over all 16 subjects in the study is 3.0 pounds with the standard deviation of differences computed as 6.0 pounds.
-Referring to Scenario 10-6,what is the 95% confidence interval estimate for the mean difference in weight before and after the diet?
(Short Answer)
4.8/5 (33)
A powerful women's group has claimed that men and women differ in attitudes about sexual discrimination.A group of 50 men (group 1)and 40 women (group 2)were asked if they thought sexual discrimination is a problem in the United States.Of those sampled,11 of the men and 19 of the women did believe that sexual discrimination is a problem.Find the value of the test statistic.
(Multiple Choice)
4.8/5 (40)
A powerful women's group has claimed that men and women differ in attitudes about sexual discrimination.A group of 50 men (group 1)and 40 women (group 2)were asked if they thought sexual discrimination is a problem in the United States.Of those sampled,11 of the men and 19 of the women did believe that sexual discrimination is a problem.Construct a 95% confidence interval estimate of the difference between the proportion of men and women who believe that sexual discrimination is a problem.
(Short Answer)
5.0/5 (30)
The Wall Street Journal recently published an article indicating differences in perception of sexual harassment on the job between men and women.The article claimed that women perceived the problem to be much more prevalent than did men.One question asked of both men and women was: "Do you think sexual harassment is a major problem in the American workplace?" 24% of the men compared to 62% of the women responded "Yes." Assuming W designates women's responses and M designates men's,what hypothesis should The Wall Street Journal test in order to show that its claim is true?
(Multiple Choice)
4.9/5 (38)
In testing for the differences between the means of two related populations,you assume that the differences follow a _____distribution.
(Short Answer)
4.8/5 (41)
SCENARIO 10-11
The dean of a college is interested in the proportion of graduates from his college who have a job offer on graduation day.He is particularly interested in seeing if there is a difference in this proportion for accounting and economics majors.In a random sample of 100 of each type of major at graduation,he found that 65 accounting majors and 52 economics majors had job offers.If the accounting majors are designated as "Group 1" and the economics majors are designated as "Group 2," perform the appropriate hypothesis test using a level of significance of 0.05.
-Referring to Scenario 10-11,the value of the test statistic is .
(Short Answer)
4.8/5 (46)
SCENARIO 10-1
Are Japanese managers more motivated than American managers? A randomly selected group of each were administered the Sarnoff Survey of Attitudes Toward Life (SSATL),which measures motivation for upward mobility.The SSATL scores are summarized below.
 -Referring to Scenario 10-1,what is the value of the test statistic?
(Multiple Choice)
4.9/5 (38)
SCENARIO 10-3
A real estate company is interested in testing whether the mean time that families in Gotham have been living in their current homes is less than families in Metropolis.Assume that the two population variances are equal.A random sample of 100 families from Gotham and a random sample of 150 families in Metropolis yield the following data on length of residence in current homes. Gotham: x̄ G = 35 months,SG 2 = 900 Metropolis: x̄ M = 50 months,S M2 = 1050
-Referring to Scenario 10-3,what is(are)the critical value(s)of the relevant hypothesis test if the level of significance is 0.01?
(Multiple Choice)
4.7/5 (36)
If we are testing for the difference between the means of 2 related populations with samples of n1 = 20 and n2 = 20,the number of degrees of freedom is equal to
(Multiple Choice)
4.9/5 (30)
SCENARIO 10-9
The following EXCEL output contains the results of a test to determine whether the proportions of satisfied customers at two resorts are the same or different.
 Two-Sample Tests 10-31
-Referring to Scenario 10-9,allowing for 1% probability of committing a Type I error,what are the decision and conclusion on testing whether there is any difference in the proportions of satisfied customers in the two resorts?
Two-Sample Tests 10-31
-Referring to Scenario 10-9,allowing for 1% probability of committing a Type I error,what are the decision and conclusion on testing whether there is any difference in the proportions of satisfied customers in the two resorts?
(Multiple Choice)
4.8/5 (34)
SCENARIO 10-15
The table below presents the summary statistics for the starting annual salaries (in thousands of dollars)for individuals entering the public accounting and financial planning professions.
Sample I (public accounting):
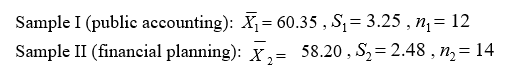 Test whether the mean starting annual salaries for individuals entering the public accounting professions is higher than that of financial planning assuming that the two population variances are the same.
-Referring to Scenario 10-15,suppose α = 0.01.Which of the following represents the correct conclusion?
Test whether the mean starting annual salaries for individuals entering the public accounting professions is higher than that of financial planning assuming that the two population variances are the same.
-Referring to Scenario 10-15,suppose α = 0.01.Which of the following represents the correct conclusion?
(Multiple Choice)
4.8/5 (37)
SCENARIO 10-10
A corporation randomly selects 150 salespeople and finds that 66% who have never taken a self- improvement course would like such a course.The firm did a similar study 10 years ago in which 60% of a random sample of 160 salespeople wanted a self-improvement course.The groups are assumed to be independent random samples.Let 1 and 2 represent the true proportion of workers who would like to attend a self-improvement course in the recent study and the past study,respectively.
-Referring to Scenario 10-10,what is the estimated standard error of the difference between the two sample proportions?
(Multiple Choice)
4.8/5 (37)
For all two-sample tests,the sample sizes must be equal in the two groups.
(True/False)
4.9/5 (40)
SCENARIO 10-8
A few years ago,Pepsi invited consumers to take the "Pepsi Challenge." Consumers were asked to decide which of two sodas,Coke or Pepsi,they preferred in a blind taste test.Pepsi was interested in determining what factors played a role in people's taste preferences.One of the factors studied was the gender of the consumer.Below are the results of analyses comparing the taste preferences of men and women with the proportions depicting preference for Pepsi.
Males: n = 109,pM = 0.422018 Females: n = 52,pF = 0.25
pM - pF = 0.172018 Z = 2.11825
-Referring to Scenario 10-8,to determine if a difference exists in the taste preferences of men and women,give the correct alternative hypothesis that Pepsi would test.
(Multiple Choice)
4.9/5 (35)
SCENARIO 10-12
A quality control engineer is in charge of the manufacture of USB flash drives.Two different processes can be used to manufacture the flash drives.He suspects that the Kohler method produces a greater proportion of defects than the Russell method.He samples 150 of the Kohler and 200 of the Russell flash drives and finds that 27 and 18 of them,respectively,are defective.If Kohler is designated as "Group 1" and Russell is designated as "Group 2," perform the appropriate test at a level of significance of 0.01.
-Referring to Scenario 10-12,the null hypothesis will be rejected if the test statistic is .
(Short Answer)
4.8/5 (39)
Filters
- Essay(0)
- Multiple Choice(0)
- Short Answer(0)
- True False(0)
- Matching(0)