Exam 17: Business Analytics
Exam 1: Defining and Collecting Data204 Questions
Exam 2: Organizing and Visualizing Variables185 Questions
Exam 3: Numerical Descriptive Measures167 Questions
Exam 4: Basic Probability163 Questions
Exam 5: Discrete Probability Distributions216 Questions
Exam 6: The Normal Distribution and Other Continuous Distributions187 Questions
Exam 7: Sampling Distributions129 Questions
Exam 8: Confidence Interval Estimation189 Questions
Exam 9: Fundamentals of Hypothesis Testing: One-Sample Tests185 Questions
Exam 10: Two-Sample Tests212 Questions
Exam 11: Analysis of Variance210 Questions
Exam 12: Chi-Square and Nonparametric Tests175 Questions
Exam 13: Simple Linear Regression210 Questions
Exam 14: Introduction to Multiple Regression256 Questions
Exam 15: Multiple Regression Model Building67 Questions
Exam 16: Time-Series Forecasting168 Questions
Exam 17: Business Analytics113 Questions
Exam 18: A Roadmap for Analyzing Data325 Questions
Exam 19: Statistical Applications in Quality Management158 Questions
Exam 20: Decision Making123 Questions
Exam 21: Getting Started: Important Things to Learn First35 Questions
Exam 22: Binomial Distribution and Normal Approximation230 Questions
Select questions type
In real-world business analytics,filtering is typically performed on large data based on complex conditional relationships.
Free
(True/False)
4.9/5  (34)
(34)
Correct Answer: Verified
True
Which of the following is NOT among the three broad categories of analytic methods?
Free
(Multiple Choice)
4.9/5 (34)
Correct Answer:Verified
C
SCENARIO 17-1
The table below contains the sparklines for the rates of return (in percentage)for three different stocks from 2007 to 2013.
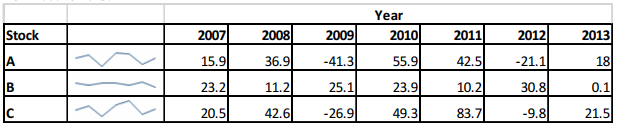 -Referring to Scenario 17-1,the sparklines enable you to draw conclusions on the historical trend of the rates of return of the three stocks.
Free
(True/False)
4.9/5 (41)
Correct Answer:Verified
True
Ward's minimum variance can be used to measure the distance between clusters in cluster analysis.
(True/False)
4.7/5 (38)
The prescriptive analytics technique in which the decision maker sets constraints that reflect resource limitations to determine how the process works most effectively is called simulation.
(True/False)
5.0/5 (38)
In multidimensional scaling,the general rule is to increase the number of dimensions as long as the stress statistic decreases substantially.
(True/False)
4.9/5 (33)
SCENARIO 17-1
The table below contains the sparklines for the rates of return (in percentage)for three different stocks from 2007 to 2013.
-Referring to Scenario 17-1,the sparklines enable you to predict that the rates of return of the stock market in 2014 will be about the same as in 2013.
(True/False)
4.7/5 (36)
SCENARIO 17-7
The output below shows the results of cluster analysis on the different regions of the world (North America,Asia Pacific,Western Europe,Central & Eastern Europe,Latin America,and Middle East & Africa)based on the amounts (in billions of US dollars)and the percentage changes from prior year of business-to-consumer ecommerce sales last year.
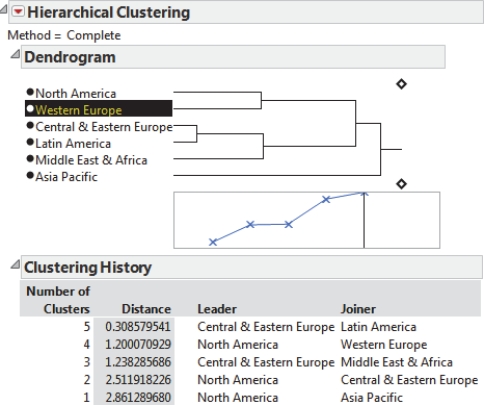 -Referring to Scenario 17-7,at the two cluster level,Asia Pacific alone makes up one of the two clusters.
(True/False)
4.9/5 (44)
Most information design specialists prefer bullet graphs over gauges because bullet graphs foster the direct comparison of each measurement.
(True/False)
4.9/5 (32)
Neural networks do not make any a priori assumption about the distribution of the data and,hence,are nonparametric methods.
(True/False)
4.9/5 (37)
Which of the following disciplines is typically NOT involved in business analytics?
(Multiple Choice)
4.8/5 (29)
Successful implementation of a regression tree requires rules for deciding when a branch of the tree cannot be split any more.
(True/False)
4.9/5 (30)
Which of the following is NOT among the predictive analytics methods covered in the book?
(Multiple Choice)
4.8/5 (29)
SCENARIO 17-7
The output below shows the results of cluster analysis on the different regions of the world (North America,Asia Pacific,Western Europe,Central & Eastern Europe,Latin America,and Middle East & Africa)based on the amounts (in billions of US dollars)and the percentage changes from prior year of business-to-consumer ecommerce sales last year.
-Referring to Scenario 17-7,what are the first group of countries that cluster together?
(Short Answer)
4.8/5 (35)
SCENARIO 17-7
The output below shows the results of cluster analysis on the different regions of the world (North America,Asia Pacific,Western Europe,Central & Eastern Europe,Latin America,and Middle East & Africa)based on the amounts (in billions of US dollars)and the percentage changes from prior year of business-to-consumer ecommerce sales last year.
-Referring to Scenario 17-7,the "complete" method is used to measure the distance between clusters.
(True/False)
4.9/5 (35)
SCENARIO 17-2
The treemap below shows the amounts (size)measured in billions of US dollars and percentage changes from prior year (color)of business-to-consumer ecommerce sales last year for North America,Asia Pacific,Western Europe,Central & Eastern Europe,Latin America,and Middle East & Africa.
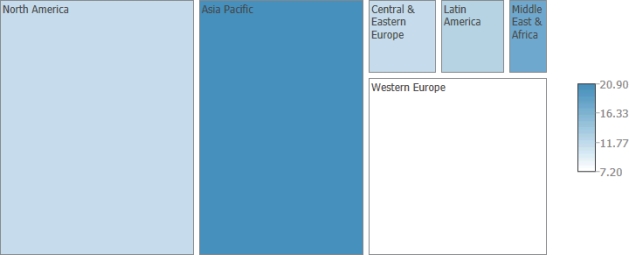 -Referring to Scenario 17-2,which region has the smallest amount of business-to-consumer ecommerce sales last year?
(Short Answer)
4.9/5 (35)
Which of the following finds relationships in data that may not be readily apparent?
(Multiple Choice)
4.8/5 (30)
Which of the following is NOT among the predictive analytics methods covered in the book?
(Multiple Choice)
4.8/5 (32)
SCENARIO 17-7
The output below shows the results of cluster analysis on the different regions of the world (North America,Asia Pacific,Western Europe,Central & Eastern Europe,Latin America,and Middle East & Africa)based on the amounts (in billions of US dollars)and the percentage changes from prior year of business-to-consumer ecommerce sales last year.
-Referring to Scenario 17-7,the "complete" method is used to measure the distance between objects within a cluster.
(True/False)
4.8/5 (40)
SCENARIO 17-1
The table below contains the sparklines for the rates of return (in percentage)for three different stocks from 2007 to 2013.
-Referring to Scenario 17-1,the sparklines enable you to predict that the rates of return of the stock market in 2014 will be higher than in 2013.
(True/False)
4.7/5 (41)
Filters
- Essay(0)
- Multiple Choice(0)
- Short Answer(0)
- True False(0)
- Matching(0)