Exam 12: Chi-Square and Nonparametric Tests
Exam 1: Defining and Collecting Data204 Questions
Exam 2: Organizing and Visualizing Variables185 Questions
Exam 3: Numerical Descriptive Measures167 Questions
Exam 4: Basic Probability163 Questions
Exam 5: Discrete Probability Distributions216 Questions
Exam 6: The Normal Distribution and Other Continuous Distributions187 Questions
Exam 7: Sampling Distributions129 Questions
Exam 8: Confidence Interval Estimation189 Questions
Exam 9: Fundamentals of Hypothesis Testing: One-Sample Tests185 Questions
Exam 10: Two-Sample Tests212 Questions
Exam 11: Analysis of Variance210 Questions
Exam 12: Chi-Square and Nonparametric Tests175 Questions
Exam 13: Simple Linear Regression210 Questions
Exam 14: Introduction to Multiple Regression256 Questions
Exam 15: Multiple Regression Model Building67 Questions
Exam 16: Time-Series Forecasting168 Questions
Exam 17: Business Analytics113 Questions
Exam 18: A Roadmap for Analyzing Data325 Questions
Exam 19: Statistical Applications in Quality Management158 Questions
Exam 20: Decision Making123 Questions
Exam 21: Getting Started: Important Things to Learn First35 Questions
Exam 22: Binomial Distribution and Normal Approximation230 Questions
Select questions type
The Journal of Business Venturing reported on the activities of entrepreneurs during the organization creation process.As part of a designed study,a total of 71 entrepreneurs were interviewed and divided into 3 groups: those that were successful in founding a new firm (n1 = 34),those still actively trying to establish a firm (n2 = 21),and those who tried to start a new firm but eventually gave up (n3 = 16).The total number of activities undertaken (e.g. ,developed a business plan,sought funding,looked for facilities)by each group over a specified time period during organization creation was measured.The objective is to compare the mean number of activities of the 3 groups of entrepreneurs.Because of concerns over necessary assumption of the parametric analysis,it was decided to use a nonparametric analysis.Identify the nonparametric method that would be used to analyze the data.
(Multiple Choice)
4.9/5  (35)
(35)
SCENARIO 12-13
Recent studies have found that American children are more obese than in the past. The amount of time children spent watching television has received much of the blame. A survey of 100 ten-yearolds revealed the following with regards to weights and average number of hours a day spent watching television. We are interested in testing whether the mean number of hours spent watching TV and weights are independent at 1% level of significance. 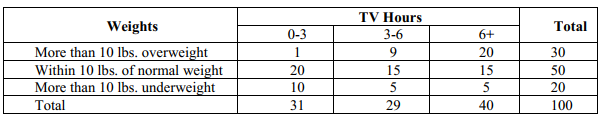 -Referring to Scenario 12-13,which of the following statements is correct?
(Multiple Choice)
4.9/5 (35)
SCENARIO 12-15
Two new different models of compact SUVs have just arrived at the market.You are interested in comparing the gas mileage performance of both models to see if they are the same.A partial computer output for twelve compact SUVs of model 1 and thirteen of model 2 is given below:
 You are told that the gas mileage population distributions for both models are not normally distributed.
-Referring to Scenario 12-15,what is(are)the critical value(s)using a 5% level of significance?
You are told that the gas mileage population distributions for both models are not normally distributed.
-Referring to Scenario 12-15,what is(are)the critical value(s)using a 5% level of significance?
(Short Answer)
4.9/5 (34)
SCENARIO 12-13
Recent studies have found that American children are more obese than in the past. The amount of time children spent watching television has received much of the blame. A survey of 100 ten-yearolds revealed the following with regards to weights and average number of hours a day spent watching television. We are interested in testing whether the mean number of hours spent watching TV and weights are independent at 1% level of significance.
-Referring to Scenario 12-12,we want to test whether there is any relationship between average time spent watching TV and average time spent reading storybooks.Suppose the value of the test statistic was 164 (which is the correct answer),then we could conclude that
(Multiple Choice)
4.8/5 (37)
SCENARIO 12-5
Four surgical procedures currently are used to install pacemakers.If the patient does not need to return for follow-up surgery,the operation is called a "clear" operation.A heart center wants to compare the proportion of clear operations for the 4 procedures,and collects the following numbers of patients from their own records:
Procedure
 They will use this information to test for a difference among the proportion of clear operations using a chi-square test with a level of significance of 0.05.
-Referring to Scenario 12-5,there is sufficient evidence to conclude that the proportions between procedure B and procedure D are different at a 0.05 level of significance.
They will use this information to test for a difference among the proportion of clear operations using a chi-square test with a level of significance of 0.05.
-Referring to Scenario 12-5,there is sufficient evidence to conclude that the proportions between procedure B and procedure D are different at a 0.05 level of significance.
(True/False)
4.7/5 (39)
SCENARIO 12-7
Data on the percentage of 200 hotels in each of the three large cities across the world on whether minibar charges are correctly posted at checkout are given below.
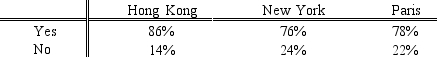 At the 0.05 level of significance,you want to know if there is evidence of a difference in the proportion of hotels that correctly post minibar charges among the three cities.
-Referring to Scenario 12-7,there is sufficient evidence to conclude that the proportions between New York and Paris are different at a 0.05 level of significance.
At the 0.05 level of significance,you want to know if there is evidence of a difference in the proportion of hotels that correctly post minibar charges among the three cities.
-Referring to Scenario 12-7,there is sufficient evidence to conclude that the proportions between New York and Paris are different at a 0.05 level of significance.
(True/False)
4.8/5 (29)
SCENARIO 12-6
According to an article in Marketing News,fewer checks are being written at the grocery store checkout than in the past.To determine whether there is a difference in the proportion of shoppers who pay by check among three consecutive years at a 0.05 level of significance,the results of a survey of 500 shoppers in three consecutive years are obtained and presented below.
 -Referring to Scenario 12-6,what is the p-value of the test statistic?
(Short Answer)
4.8/5 (30)
SCENARIO 12-4
A computer used by a 24-hour banking service is supposed to randomly assign each transaction to one of 5 memory locations.A check at the end of a day's transactions gave the counts shown in the table to each of the 5 memory locations,along with the number of reported errors.
 The bank manager wanted to test whether the proportion of errors in transactions assigned to each of the 5 memory locations differ.
-Referring to Scenario 12-4,which test would be used to properly analyze the data in this experiment?
The bank manager wanted to test whether the proportion of errors in transactions assigned to each of the 5 memory locations differ.
-Referring to Scenario 12-4,which test would be used to properly analyze the data in this experiment?
(Multiple Choice)
4.9/5 (37)
SCENARIO 12-10
One criterion used to evaluate employees in the assembly section of a large factory is the number of defective pieces per 1,000 parts produced.The quality control department wants to find out whether there is a relationship between years of experience and defect rate.Since the job is repetitious,after the initial training period any improvement due to a learning effect might be offset by a loss of motivation.A defect rate is calculated for each worker in a yearly evaluation.The results for 100 workers are given in the table below.
 -Referring to Scenario 12-10,what is the expected number of employees with 1 to 4 years of training time and a high defect rate?
(Multiple Choice)
4.8/5 (32)
SCENARIO 12-4
A computer used by a 24-hour banking service is supposed to randomly assign each transaction to one of 5 memory locations.A check at the end of a day's transactions gave the counts shown in the table to each of the 5 memory locations,along with the number of reported errors.
The bank manager wanted to test whether the proportion of errors in transactions assigned to each of the 5 memory locations differ.
-Referring to Scenario 12-4,the critical value of the test statistic at 1% level of significance is
(Multiple Choice)
4.7/5 (37)
SCENARIO 12-1
A corporation randomly selects 150 salespeople and finds that 66% who have never taken a self- improvement course would like such a course.The firm did a similar study 10 years ago in which 60% of a random sample of 160 salespeople wanted a self-improvement course.The groups are assumed to be independent random samples.Let 1 and 2 represent the true proportion of workers who would like to attend a self-improvement course in the recent study and the past study,respectively.
-Referring to Scenario 12-1,if the firm wanted to test whether this proportion has changed from the previous study,which represents the relevant hypotheses?
(Multiple Choice)
4.8/5 (25)
In testing for differences between the median of two independent populations,the null hypothesis is
(Multiple Choice)
4.7/5 (35)
SCENARIO 12-16
As part of an evaluation program,a sporting goods retailer wanted to compare the downhill coasting speeds of 4 brands of bicycles.She took 3 of each brand and determined their maximum downhill speeds.The results are presented in miles per hour in the table below.
 -Referring to Scenario 12-16,the calculated value of the Kruskal-Wallis test statistic H is
.
-Referring to Scenario 12-16,the calculated value of the Kruskal-Wallis test statistic H is
.
(Short Answer)
4.9/5 (36)
SCENARIO 12-7
Data on the percentage of 200 hotels in each of the three large cities across the world on whether minibar charges are correctly posted at checkout are given below.
At the 0.05 level of significance,you want to know if there is evidence of a difference in the proportion of hotels that correctly post minibar charges among the three cities.
-Referring to Scenario 12-7,the expected cell frequency for the Hong Kong/Yes cell is
.
(Short Answer)
4.8/5 (31)
In testing the difference between two proportions using the normal distribution,we may use either a one-tail Chi-square test or two-tail Z test.
(True/False)
4.8/5 (33)
SCENARIO 12-15
Two new different models of compact SUVs have just arrived at the market.You are interested in comparing the gas mileage performance of both models to see if they are the same.A partial computer output for twelve compact SUVs of model 1 and thirteen of model 2 is given below:
You are told that the gas mileage population distributions for both models are not normally distributed.
-Referring to Scenario 12-15,what is the value of the Z test statistic?
(Short Answer)
4.9/5 (31)
SCENARIO 12-2
The dean of a college is interested in the proportion of graduates from his college who have a job offer on graduation day.He is particularly interested in seeing if there is a difference in this proportion for accounting and economics majors.In a random sample of 100 of each type of major at graduation,he found that 65 accounting majors and 52 economics majors had job offers.If the accounting majors are designated as "Group 1" and the economics majors are designated as "Group 2," perform the appropriate hypothesis test using a level of significance of 0.05.
-Referring to Scenario 12-2,the value of the test statistic is .
(Short Answer)
5.0/5 (30)
SCENARIO 12-13
Recent studies have found that American children are more obese than in the past. The amount of time children spent watching television has received much of the blame. A survey of 100 ten-yearolds revealed the following with regards to weights and average number of hours a day spent watching television. We are interested in testing whether the mean number of hours spent watching TV and weights are independent at 1% level of significance.
-Referring to Scenario 12-13,the degrees of freedom of the test statistic are
(Multiple Choice)
4.8/5 (42)
SCENARIO 12-16
As part of an evaluation program,a sporting goods retailer wanted to compare the downhill coasting speeds of 4 brands of bicycles.She took 3 of each brand and determined their maximum downhill speeds.The results are presented in miles per hour in the table below.
-Referring to Scenario 12-16,the alternative hypothesis of the Kruskal-Wallis test is that.
(Short Answer)
4.9/5 (32)
SCENARIO 12-6
According to an article in Marketing News,fewer checks are being written at the grocery store checkout than in the past.To determine whether there is a difference in the proportion of shoppers who pay by check among three consecutive years at a 0.05 level of significance,the results of a survey of 500 shoppers in three consecutive years are obtained and presented below.
-Referring to Scenario 12-6,there is sufficient evidence to conclude that the proportions between year 1 and year 2 are different at a 0.05 level of significance.
(True/False)
4.8/5 (37)
Filters
- Essay(0)
- Multiple Choice(0)
- Short Answer(0)
- True False(0)
- Matching(0)