Exam 19: Statistical Applications in Quality Management
Exam 1: Defining and Collecting Data204 Questions
Exam 2: Organizing and Visualizing Variables185 Questions
Exam 3: Numerical Descriptive Measures167 Questions
Exam 4: Basic Probability163 Questions
Exam 5: Discrete Probability Distributions216 Questions
Exam 6: The Normal Distribution and Other Continuous Distributions187 Questions
Exam 7: Sampling Distributions129 Questions
Exam 8: Confidence Interval Estimation189 Questions
Exam 9: Fundamentals of Hypothesis Testing: One-Sample Tests185 Questions
Exam 10: Two-Sample Tests212 Questions
Exam 11: Analysis of Variance210 Questions
Exam 12: Chi-Square and Nonparametric Tests175 Questions
Exam 13: Simple Linear Regression210 Questions
Exam 14: Introduction to Multiple Regression256 Questions
Exam 15: Multiple Regression Model Building67 Questions
Exam 16: Time-Series Forecasting168 Questions
Exam 17: Business Analytics113 Questions
Exam 18: A Roadmap for Analyzing Data325 Questions
Exam 19: Statistical Applications in Quality Management158 Questions
Exam 20: Decision Making123 Questions
Exam 21: Getting Started: Important Things to Learn First35 Questions
Exam 22: Binomial Distribution and Normal Approximation230 Questions
Select questions type
SMED establishes ways to eliminate unnecessary housekeeping aspects of a work environment.
(True/False)
4.9/5  (31)
(31)
Which of the following is not part of the Shewhart-Deming cycle?
(Multiple Choice)
4.7/5 (40)
SCENARIO 19-5
A manufacturer of computer disks took samples of 240 disks on 15 consecutive days.The number of disks with bad sectors was determined for each of these samples.The results are in the table that follows.
 -Referring to Scenario 19-5,the process seems to be in control.
(True/False)
4.8/5 (36)
SCENARIO 19-7
A supplier of silicone sheets for producers of computer chips wants to evaluate her manufacturing process.She takes samples of size 5 from each day's output and counts the number of blemishes on each silicone sheet.The results from 20 days of such evaluations are presented below.
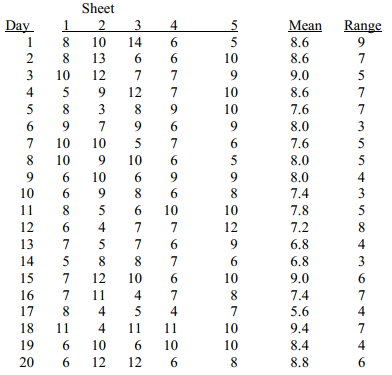 She also decides that the upper specification limit is 10 blemishes.
-Referring to Scenario 19-7,construct an R chart for the number of blemishes.
She also decides that the upper specification limit is 10 blemishes.
-Referring to Scenario 19-7,construct an R chart for the number of blemishes.
(Essay)
4.9/5 (39)
Cp >1 indicates that if the process average can be centered,then more than 99.73% of the observations will fall inside the specification limits.
(True/False)
4.7/5 (45)
SCENARIO 19-7
A supplier of silicone sheets for producers of computer chips wants to evaluate her manufacturing process.She takes samples of size 5 from each day's output and counts the number of blemishes on each silicone sheet.The results from 20 days of such evaluations are presented below.
She also decides that the upper specification limit is 10 blemishes.
-Referring to Scenario 19-7,what percentage of the chips will fall below the upper specification limit?
(Short Answer)
4.8/5 (37)
Changes in the system to reduce common cause variation are the responsibility of management.
(True/False)
4.9/5 (40)
Which of the following situations suggests a process that appears to be operating out of statistical control?
(Multiple Choice)
4.8/5 (34)
SCENARIO 19-9
The manufacturer of canned food constructed control charts and analyzed several quality characteristics.One characteristic of interest is the weight of the filled cans.The lower specification limit for weight is 2.95 pounds.The table below provides the range and mean of the weights of five cans tested every fifteen minutes during a day's production.
 -Referring to Scenario 19-9,construct an R chart for the time required to register.
(Essay)
4.9/5 (41)
SCENARIO 19-8
Recently,a university switched to a new type of computer-based registration.The registrar is concerned with the amount of time students are spending on the computer registering under the new system.She decides to randomly select 8 students on each of the 12 days of the registration and determine the time each spends on the computer registering.The range,mean,and standard deviation of the times required to register are in the table that follows.
 -Referring to Scenario 19-8,an R chart is to be constructed for the time required to register.The upper control limit for this data set is .
(Short Answer)
4.9/5 (45)
SCENARIO 19-7
A supplier of silicone sheets for producers of computer chips wants to evaluate her manufacturing process.She takes samples of size 5 from each day's output and counts the number of blemishes on each silicone sheet.The results from 20 days of such evaluations are presented below.
She also decides that the upper specification limit is 10 blemishes.
-Referring to Scenario 19-7,an R chart is to be constructed for the number of blemishes.The upper control limit for this data set is .
(Short Answer)
4.9/5 (46)
Treating common cause variation as special cause variation is known as interference.
(True/False)
4.9/5 (40)
SCENARIO 19-10
Below is the number of defective items from a production line over twenty consecutive morning shifts.
 -Referring to Scenario 19-10,based on the c chart,it appears that the process is out of control.
(True/False)
4.9/5 (31)
SCENARIO 19-1
A local newspaper has 10 delivery boys who each deliver the morning paper to 50 customers every day.The owner decides to record the number of papers delivered on time for a 10-day period for one of the delivery boys and construct a p chart to see whether the percentage is too erratic.
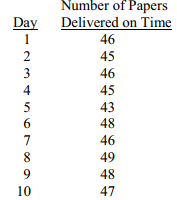 -Referring to Scenario 19-1,what is the numerical value of the upper control limit for the p chart?
(Multiple Choice)
4.8/5 (35)
Which of the following is not part of the DMAIC process in Six Sigma management?
(Multiple Choice)
4.7/5 (36)
The control limits are based on the standard deviation of the process.
(True/False)
4.7/5 (32)
SCENARIO 19-8
Recently,a university switched to a new type of computer-based registration.The registrar is concerned with the amount of time students are spending on the computer registering under the new system.She decides to randomly select 8 students on each of the 12 days of the registration and determine the time each spends on the computer registering.The range,mean,and standard deviation of the times required to register are in the table that follows.
-Referring to Scenario 19-8,an x̄ chart is to be used for the time required to register.The center line of this chart is located at .
(Short Answer)
4.7/5 (34)
Poke-Yoke devices establish ways to clean and maintain the necessary housekeeping aspects of a work environment.
(True/False)
4.9/5 (46)
Filters
- Essay(0)
- Multiple Choice(0)
- Short Answer(0)
- True False(0)
- Matching(0)