Exam 5: Elasticity and Its Application
Exam 1: Ten Principles of Economics455 Questions
Exam 2: Thinking Like an Economist645 Questions
Exam 3: Interdependence and the Gains From Trade550 Questions
Exam 4: The Market Forces of Supply and Demand693 Questions
Exam 5: Elasticity and Its Application625 Questions
Exam 6: Supply, Demand, and Government Policies671 Questions
Exam 7: Consumers, Producers, and the Efficiency of Markets547 Questions
Exam 8: Application: The Costs of Taxation507 Questions
Exam 9: Application: International Trade521 Questions
Exam 10: Externalities543 Questions
Exam 11: Public Goods and Common Resources453 Questions
Exam 12: The Design of the Tax System563 Questions
Exam 13: The Costs of Production649 Questions
Exam 14: Firms in Competitive Markets608 Questions
Exam 15: Monopoly662 Questions
Exam 16: Monopolistic Competition649 Questions
Exam 17: Oligopoly522 Questions
Exam 18: The Markets for the Factors of Production592 Questions
Exam 19: Earnings and Discrimination511 Questions
Exam 20: Income Inequality and Poverty478 Questions
Exam 21: The Theory of Consumer Choice568 Questions
Exam 22: Frontiers in Microeconomics461 Questions
Select questions type
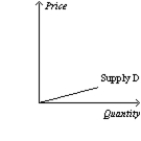
Figure 5-4 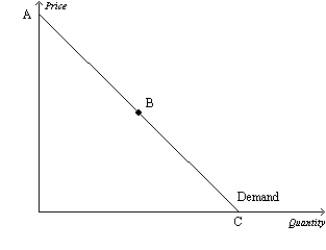 -Refer to Figure 5-4. If the price increases in the region of the demand curve between points B and C, we can expect total revenue to
(Multiple Choice)
4.8/5  (27)
(27)
Last year, Jim bought 8 tickets to sporting events when his income was $30,000. This year, his income is $33,000, and he purchased 10 tickets to sporting events. Holding other factors constant and using the midpoint method, it follows that Jim's income elasticity of demand is about
(Multiple Choice)
4.7/5 (35)
Figure 5-19 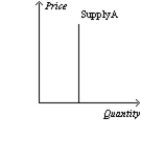
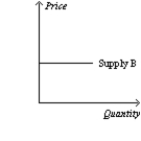
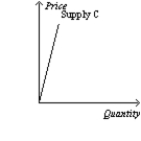
 -Refer to Figure 5-19. Which of the following statements is correct?
(Multiple Choice)
4.7/5 (37)
If the cross-price elasticity of demand for two goods is -4.5, then
(Multiple Choice)
4.9/5 (37)
If the price elasticity of demand for a good is 0.5, then a 5 percent increase in price results in a
(Multiple Choice)
4.9/5 (39)
Table 5-5 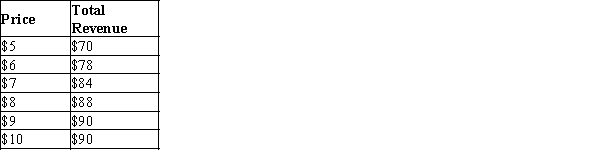 -Refer to Table 5-5. As price rises from $5 to $6, the price elasticity of demand using the midpoint method is approximately
(Multiple Choice)
4.8/5 (41)
If sellers do not adjust their quantities supplied at all in response to a change in price,
(Multiple Choice)
4.9/5 (32)
An increase in the price of cheese crackers from $2.25 to $2.45 per box causes suppliers of cheese crackers to increase their quantity supplied from 125 boxes per minute to 145 boxes per minute. Using the midpoint method, supply is
(Multiple Choice)
5.0/5 (32)
Necessities tend to have inelastic demands, whereas luxuries tend to have elastic demands.
(True/False)
4.8/5 (33)
Helen's Honey Hut supplies 20 jars of honey per week when the price of honey is $6 per jar and supplies 30 jars per week when the price of is $8 per jar, so the price elasticity of supply over this price range is 1.4.
(True/False)
4.9/5 (33)
Table 5-7
The following table shows a portion of the demand schedule for a particular good at various levels of income. 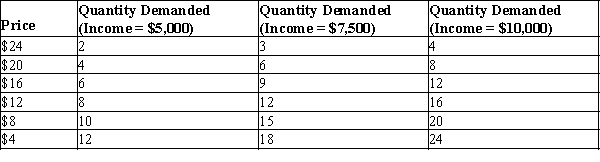 -Refer to Table 5-7. Using the midpoint method, when income equals $7,500, what is the price elasticity of demand between $16 and $20?
(Multiple Choice)
4.7/5 (39)
When supply is perfectly elastic, the value of the price elasticity of supply is
(Multiple Choice)
4.9/5 (39)
When we move upward and to the left along a linear, downward-sloping demand curve, price elasticity of demand
(Multiple Choice)
4.7/5 (32)
If the price elasticity of demand for a good is 0.2, then a 3 percent decrease in price results in a
(Multiple Choice)
4.8/5 (35)
Consider luxury weekend hotel packages in Las Vegas. When the price is $250, the quantity demanded is 2,000 packages per week. When the price is $280, the quantity demanded is 1,700 packages per week. Using the midpoint method, the price elasticity of demand is about
(Multiple Choice)
4.8/5 (33)
If the income elasticity of demand for a good is -1.40, is the good a normal or inferior good?
(Short Answer)
4.9/5 (33)
Suppose the price of apples decreases from $1.00 to $0.80 each and, as a result, the quantity of apples demanded increases from 800 to 1,000. Using the midpoint method, the price elasticity of demand for apples in the given price range is
(Multiple Choice)
4.8/5 (30)
If the price elasticity of supply is 0.5 and the quantity supplied decreases by 6%, then the price must have decreased by 3%.
(True/False)
4.7/5 (39)
Figure 5-4
-Refer to Figure 5-4. Assume the section of the demand curve from B to C corresponds to prices between $0 and $15. Then, when the price changes between $7 and $9,
(Multiple Choice)
4.8/5 (32)
Filters
- Essay(0)
- Multiple Choice(0)
- Short Answer(0)
- True False(0)
- Matching(0)