Exam 10: Externalities
Exam 1: Ten Principles of Economics455 Questions
Exam 2: Thinking Like an Economist645 Questions
Exam 3: Interdependence and the Gains From Trade550 Questions
Exam 4: The Market Forces of Supply and Demand693 Questions
Exam 5: Elasticity and Its Application625 Questions
Exam 6: Supply, Demand, and Government Policies671 Questions
Exam 7: Consumers, Producers, and the Efficiency of Markets547 Questions
Exam 8: Application: The Costs of Taxation507 Questions
Exam 9: Application: International Trade521 Questions
Exam 10: Externalities543 Questions
Exam 11: Public Goods and Common Resources453 Questions
Exam 12: The Design of the Tax System563 Questions
Exam 13: The Costs of Production649 Questions
Exam 14: Firms in Competitive Markets608 Questions
Exam 15: Monopoly662 Questions
Exam 16: Monopolistic Competition649 Questions
Exam 17: Oligopoly522 Questions
Exam 18: The Markets for the Factors of Production592 Questions
Exam 19: Earnings and Discrimination511 Questions
Exam 20: Income Inequality and Poverty478 Questions
Exam 21: The Theory of Consumer Choice568 Questions
Exam 22: Frontiers in Microeconomics461 Questions
Select questions type
Corrective taxes differ from most taxes in that corrective taxes
Free
(Multiple Choice)
4.9/5  (36)
(36)
Correct Answer: Verified
C
In some parts of the United States, sugar beets are grown and harvested. The process of producing usable sugar from the beets generates foul-smelling smoke. A government policy that limits the emission of smoke by sugar-beet-processing firms is an example of
Free
(Multiple Choice)
4.8/5 (33)
Correct Answer:Verified
B
This figure reflects the market for outdoor concerts in a public park surrounded by residential neighborhoods.
Figure 10-3 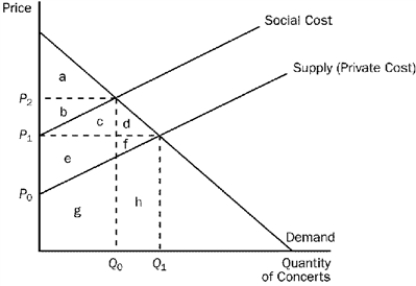 -Refer to Figure 10-3. What price and quantity combination best represents the optimum price and number of concerts that should be organized?
Free
(Multiple Choice)
4.9/5 (29)
Correct Answer:Verified
B
The concept of external cost is associated with a negative externality, but not with a positive externality.
(True/False)
4.8/5 (43)
Suppose that cigarette smokers create a negative externality. Further suppose that the government imposes a tax on cigarettes equal to the per-unit externality. What is the relationship between the after-tax equilibrium quantity and the socially optimal quantity of cigarettes?
(Multiple Choice)
4.8/5 (34)
Figure 10-9 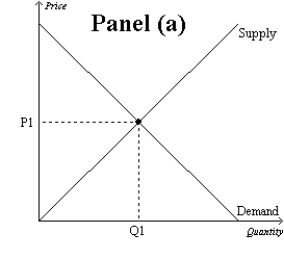
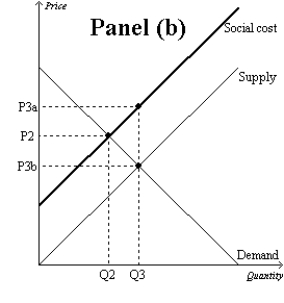
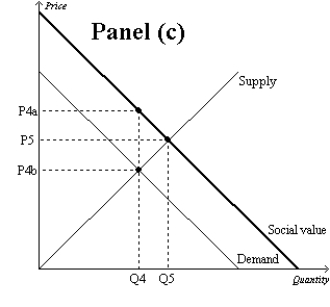 -Refer to Figure 10-9. Which graph represents a market with no externality?
(Multiple Choice)
4.8/5 (40)
Figure 10-17 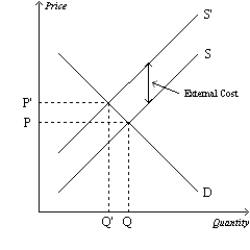 -Refer to Figure 10-17. How large would a corrective tax need to be to move this market from the equilibrium outcome to the socially-optimal outcome?
(Multiple Choice)
4.8/5 (30)
Scenario 10-1
The demand curve for gasoline slopes downward and the supply curve for gasoline slopes upward. The production of the 1,000th gallon of gasoline entails the following:
• a private cost of $3.10;
• a social cost of $3.55;
• a value to consumers of $3.70.
-Refer to Scenario 10-1. From the given information, it is apparent that
(Multiple Choice)
4.8/5 (32)
Buyers and sellers neglect the external effects of their actions when deciding how much to demand or supply.
(True/False)
4.8/5 (37)
Most economists prefer regulation to taxation because regulation corrects market inefficiencies at a lower cost than taxation does.
(True/False)
4.9/5 (40)
Suppose a certain good provides an external benefit. If the private cost of the last unit of the good that was produced is equal to the social value of that unit, then the sum of producer and consumer surplus is maximized.
(True/False)
4.8/5 (44)
Although regulation and corrective taxes are both capable of reducing pollution, regulation accomplishes this goal more efficiently.
(True/False)
4.9/5 (42)
Figure 10-20. 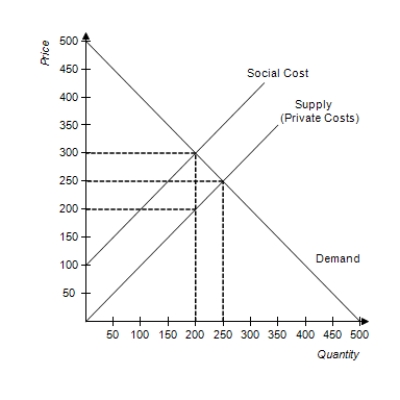 -Refer to Figure 10-20. The graph depicts the market for fertilizer. What is the socially optimal price of fertilizer?
(Multiple Choice)
4.8/5 (27)
Figure 10-18. The graph represents a corrective tax to reduce pollution. On the axes, Q denotes the quantity of pollution and P represents the price of pollution. 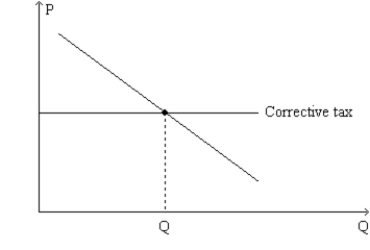 -Refer to Figure 10-18. The line labeled "Corrective tax" could accurately be re-labeled as
(Multiple Choice)
4.9/5 (37)
Filters
- Essay(0)
- Multiple Choice(0)
- Short Answer(0)
- True False(0)
- Matching(0)