Exam 5: Elasticity and Its Application
Exam 1: Ten Principles of Economics455 Questions
Exam 2: Thinking Like an Economist645 Questions
Exam 3: Interdependence and the Gains From Trade550 Questions
Exam 4: The Market Forces of Supply and Demand693 Questions
Exam 5: Elasticity and Its Application625 Questions
Exam 6: Supply, Demand, and Government Policies671 Questions
Exam 7: Consumers, Producers, and the Efficiency of Markets547 Questions
Exam 8: Application: The Costs of Taxation507 Questions
Exam 9: Application: International Trade521 Questions
Exam 10: Externalities543 Questions
Exam 11: Public Goods and Common Resources453 Questions
Exam 12: The Design of the Tax System563 Questions
Exam 13: The Costs of Production649 Questions
Exam 14: Firms in Competitive Markets608 Questions
Exam 15: Monopoly662 Questions
Exam 16: Monopolistic Competition649 Questions
Exam 17: Oligopoly522 Questions
Exam 18: The Markets for the Factors of Production592 Questions
Exam 19: Earnings and Discrimination511 Questions
Exam 20: Income Inequality and Poverty478 Questions
Exam 21: The Theory of Consumer Choice568 Questions
Exam 22: Frontiers in Microeconomics461 Questions
Select questions type
Frequently, in the short run, the quantity supplied of a good is
(Multiple Choice)
4.8/5  (24)
(24)
Why was OPEC unable to maintain high oil prices in the long run?
(Multiple Choice)
4.8/5 (29)
Table 5-5  -Refer to Table 5-5. As price rises from $7 to $8, the price elasticity of demand using the midpoint method is approximately
(Multiple Choice)
4.8/5 (40)
If the price elasticity of demand for a good is 6, then a 3 percent decrease in price results in
(Multiple Choice)
4.8/5 (36)
The production of methamphetamine (meth) is a social problem in the Midwest. Iowa is considering two potential programs: Operation Methbust would increase the number of sheriffs' deputies to search out and destroy methamphetamine labs. Operation Say No to Meth would increase the training required of public school teachers so that they could better educate students about the health risks of using meth. Assuming that each program were successful, which of the following statements is correct?
(Multiple Choice)
4.7/5 (37)
For which pairs of goods is the cross-price elasticity most likely to be positive?
(Multiple Choice)
4.8/5 (36)
If the quantity supplied responds only slightly to changes in price, then
(Multiple Choice)
4.8/5 (37)
For which of the following goods is the income elasticity of demand likely highest?
(Multiple Choice)
4.8/5 (31)
If demand is perfectly elastic, the demand curve is horizontal, and the price elasticity of demand equals 1.
(True/False)
4.8/5 (28)
Figure 5-4 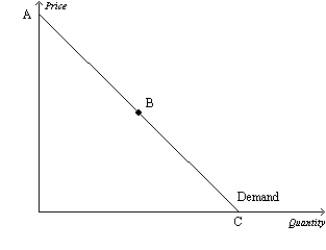 -Refer to Figure 5-4. The section of the demand curve at point B represents the
(Multiple Choice)
4.9/5 (39)
How does the concept of elasticity allow us to improve upon our understanding of supply and demand?
(Multiple Choice)
4.9/5 (40)
Scenario 5-3
Suppose that the supply of aged cheddar cheese is inelastic, and the supply of bread is elastic. Both goods are considered to be normal goods by a majority of consumers. Suppose that a large income tax increase decreases the demand for both goods by 10%.
-Refer to Scenario 5-3. The price elasticity of supply for bread could be
(Multiple Choice)
4.7/5 (34)
Figure 5-4
-Refer to Figure 5-4. If the price decreases in the region of the demand curve between points B and C, we can expect total revenue to
(Multiple Choice)
4.8/5 (25)
Figure 5-9 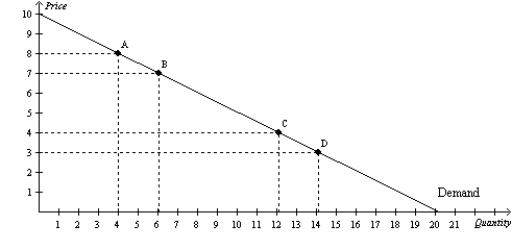 -Refer to Figure 5-9. If the price falls from point A to point B, total revenue
(Multiple Choice)
4.9/5 (42)
If a t-shirt manufacturer supplies 1,000 t-shirts per week when the price of t-shirts is $10 and supplies 1,200 t-shirts per week when the price of t-shirts is $12, the price elasticity of supply is 2.
(True/False)
5.0/5 (39)
Drug interdiction, which reduces the supply of drugs, will likely be a less effective policy than educating consumers to reduce their demand for drugs because the drug interdiction policy will lower drug prices and reduce the quantity of drugs demanded.
(True/False)
4.8/5 (41)
For which of the following goods is the income elasticity of demand likely lowest?
(Multiple Choice)
4.8/5 (36)
Which of the following statements about agriculture in the U.S. is not correct?
(Multiple Choice)
4.9/5 (33)
Even the demand for a necessity such as gasoline will respond to a change in price, especially over a longer time horizon.
(True/False)
4.7/5 (36)
Figure 5-2 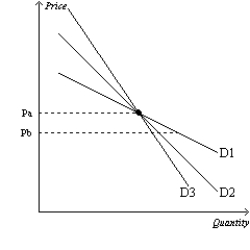 -Refer to Figure 5-2. As price falls from Pa to Pb, we could use the three demand curves to calculate three different values of the price elasticity of demand. Which of the three demand curves would produce the smallest elasticity?
(Multiple Choice)
4.8/5 (35)
Filters
- Essay(0)
- Multiple Choice(0)
- Short Answer(0)
- True False(0)
- Matching(0)