Exam 1: Getting Started
Exam 1: Getting Started200 Questions
Exam 2: The Us and Global Economies199 Questions
Exam 3: The Economic Problem99 Questions
Exam 4: Demand and Supply140 Questions
Exam 5: GDP: a Measure of Total Production and Income131 Questions
Exam 6: Jobs and Unemployment149 Questions
Exam 7: The Cpi and the Cost of Living101 Questions
Exam 8: Potential Gdp and the Natural Unemployment Rate153 Questions
Exam 9: Economic Growth152 Questions
Exam 10: Finance, Saving, and Investment151 Questions
Exam 11: The Monetary System129 Questions
Exam 12: Money, Interest, and Inflation130 Questions
Exam 13: Aggregate Supply Ad Aggregate Demand135 Questions
Exam 14: Aggregate Expenditure Multiplier72 Questions
Exam 15: The Short-Run Policy Tradeoff111 Questions
Exam 16: Fiscal Policy133 Questions
Exam 17: Monetary Policy106 Questions
Exam 18: International Trade Policy93 Questions
Exam 19: International Finance86 Questions
Select questions type
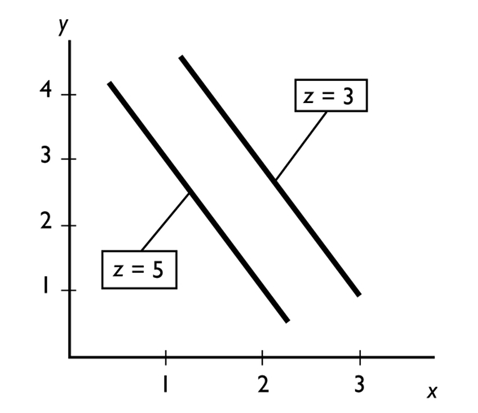 In the figure above, ceteris paribus, an increase in x is associated with
(Multiple Choice)
4.8/5  (48)
(48)
As the price of home heating oil rises, families buy less home heating oil. Hence a scatter diagram with the price of home heating oil on the vertical axis and the quantity purchased on the horizontal axis reveals a---------- relationship.
(Multiple Choice)
4.7/5 (33)
A curve with a positive but decreasing slope represents a relationship where, every time the variable measured along the horizontal axis increases by one unit, the variable measured along the vertical axis
(Multiple Choice)
4.9/5 (35)
A normative statement
I. can be tested as to whether it is true or false.
Ii. is considered negative.
Iii. depends on a person's values.
(Multiple Choice)
4.9/5 (45)
Which of the following is true?
I. A rational choice is made on the margin.
Ii. Microeconomics is the study of the national economy while macroeconomics is the study of the global economy.
Iii. Economists try to understand how the economic world works by testing normative statements.
(Multiple Choice)
4.9/5 (41)
As a shoe factory adds more workers, shoe production grows, reaches a maximum, and then shrinks. In a diagram that has the number of workers on the horizontal axis and the number of shoes on the vertical axis, the relationship between the number of workers and the number of shoes starts as -------------------- and then, after the maximum point, is --------------------.
(Multiple Choice)
4.8/5 (48)
 A straight line falls when moving rightward along it. Hence the slope of the line is
(Multiple Choice)
4.9/5 (43)
To graph a relationship that involves more than two variables, we use
(Multiple Choice)
4.7/5 (42)
We are investigating the relationship among three variables. We have graphed two of them. Suppose that the variable that is not measured on the x-axis or the y-axis changes. Then, there is
(Multiple Choice)
4.9/5 (32)
The additional benefit of increasing some activity by one-unit is called the
(Multiple Choice)
4.7/5 (42)
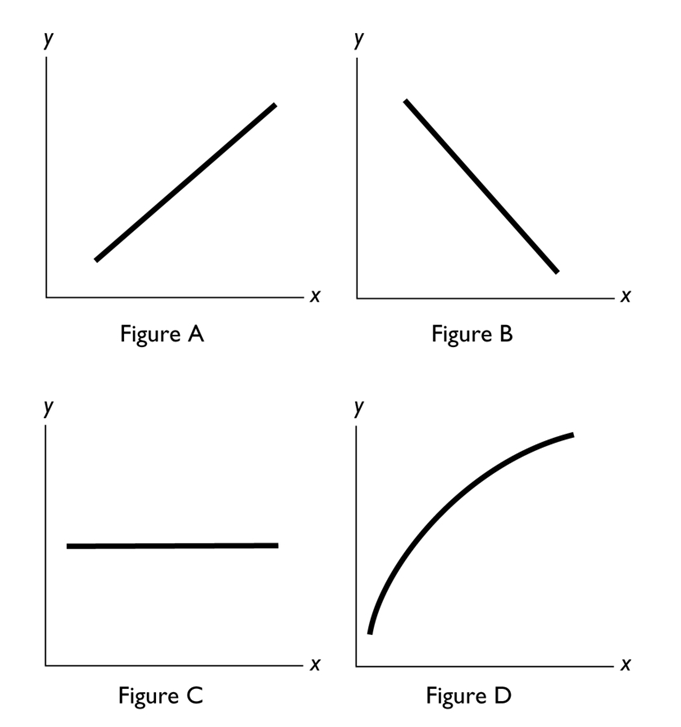 In the above figure, a negative relationship between x and y is shown in Figure
(Multiple Choice)
4.8/5 (35)
Proponents of cuts in income tax rates argue that when income tax rates are cut, workers have an incentive to increase their work hours. This argument is based on the assumption that
(Multiple Choice)
4.8/5 (36)
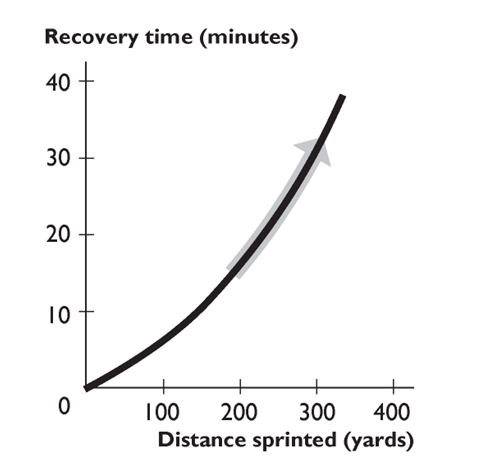 The figure above shows the relationship between distance sprinted and recovery time. The curve becomes steeper because as the distance sprinted increases,
(Multiple Choice)
4.7/5 (44)
When two variables in a graph are related to a third, changing the third causes
(Multiple Choice)
4.9/5 (41)
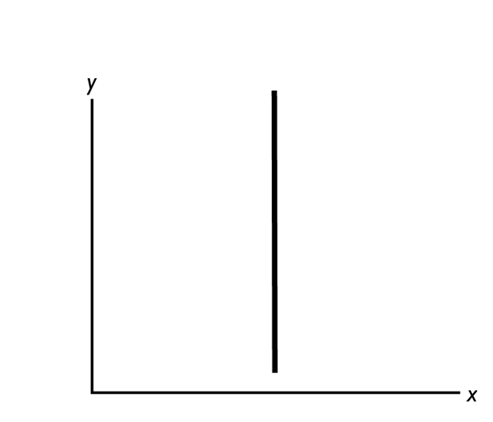
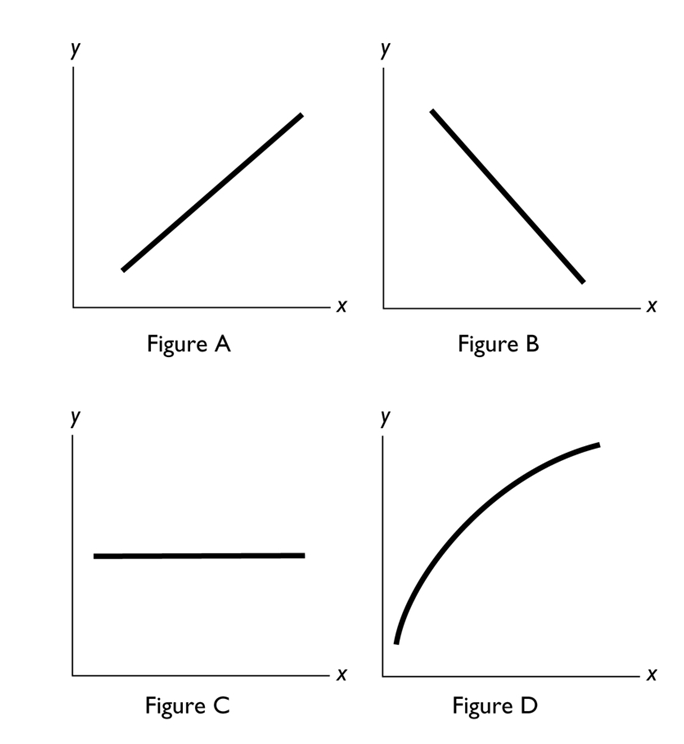 In the above figure, no relationship between x and y is shown in Figure
(Multiple Choice)
4.7/5 (37)
Filters
- Essay(0)
- Multiple Choice(0)
- Short Answer(0)
- True False(0)
- Matching(0)