Exam 1: Getting Started
Exam 1: Getting Started200 Questions
Exam 2: The Us and Global Economies199 Questions
Exam 3: The Economic Problem99 Questions
Exam 4: Demand and Supply140 Questions
Exam 5: GDP: a Measure of Total Production and Income131 Questions
Exam 6: Jobs and Unemployment149 Questions
Exam 7: The Cpi and the Cost of Living101 Questions
Exam 8: Potential Gdp and the Natural Unemployment Rate153 Questions
Exam 9: Economic Growth152 Questions
Exam 10: Finance, Saving, and Investment151 Questions
Exam 11: The Monetary System129 Questions
Exam 12: Money, Interest, and Inflation130 Questions
Exam 13: Aggregate Supply Ad Aggregate Demand135 Questions
Exam 14: Aggregate Expenditure Multiplier72 Questions
Exam 15: The Short-Run Policy Tradeoff111 Questions
Exam 16: Fiscal Policy133 Questions
Exam 17: Monetary Policy106 Questions
Exam 18: International Trade Policy93 Questions
Exam 19: International Finance86 Questions
Select questions type
Which of the following is a macroeconomic issue?
Free
(Multiple Choice)
4.9/5  (32)
(32)
Correct Answer: Verified
A
If a decision is made and it is the best choice for society, the decision is said to be
Free
(Multiple Choice)
4.8/5 (37)
Correct Answer:Verified
A
A graph shows the average wage of various demographic groups in 2012. The kind of graph used to show these data would be a
Free
(Multiple Choice)
4.9/5 (36)
Correct Answer:Verified
E
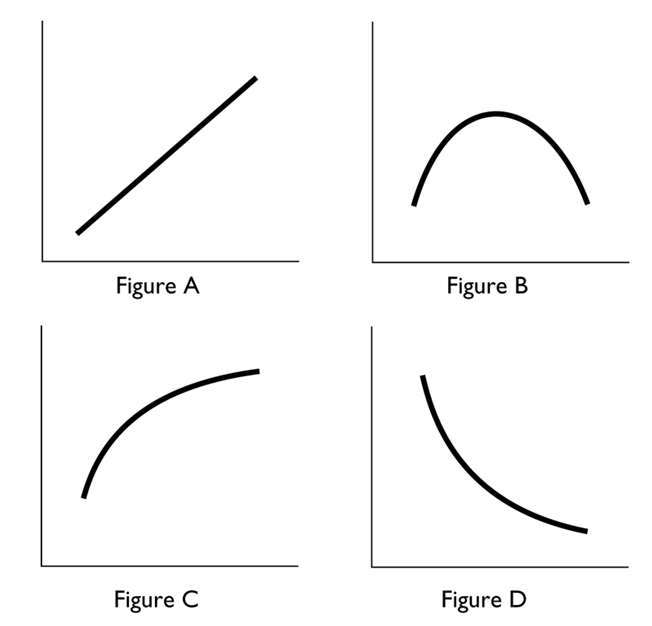 In the above, in which figure(s)is the slope the same at every point?
(Multiple Choice)
4.8/5 (30)
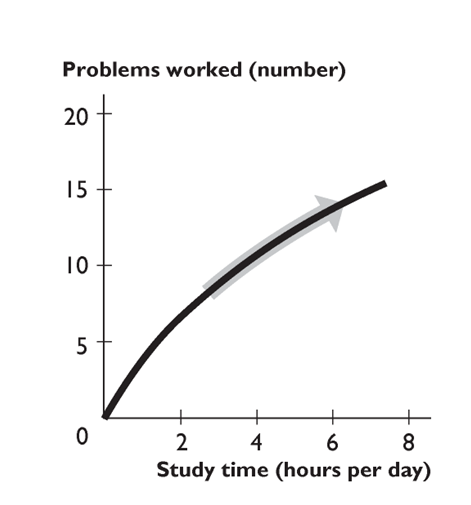 The figure above shows the relationship between study time and the number of problems worked. The curve becomes less steep because as you study more,
(Multiple Choice)
4.9/5 (42)
Of the three major economic questions, which of the following is the best example of a "What?" question?
(Multiple Choice)
4.8/5 (32)
Increasing income tax rates will solve the "social security time bomb issue" is an example of
(Multiple Choice)
4.7/5 (40)
Will, Bill, and Phil decide to study an extra hour for an exam. Instead of studying, they could have gone out to eat, played football, or watched TV. Which of the following statements is correct?
(Multiple Choice)
4.8/5 (44)
Your economics professor offers 10 points extra credit if you attend a review session before your next exam. This extra credit is an example of
(Multiple Choice)
4.9/5 (33)
Suppose the relationship between a person's age and his or her height is plotted with the age measured along the x-axis and the height measured along the y-axis. Then, the curve showing this relationship is
(Multiple Choice)
4.8/5 (38)
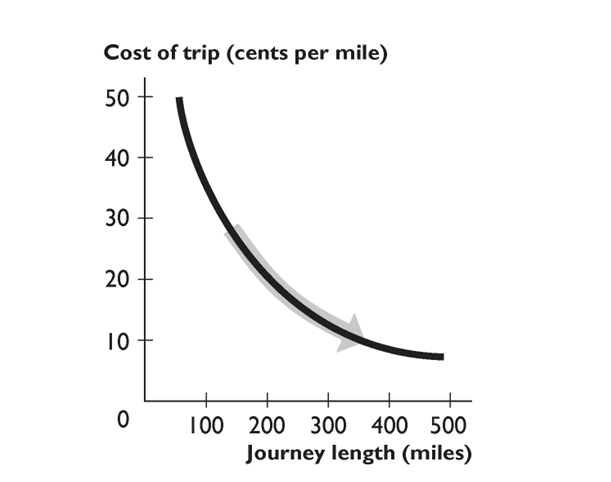 The figure above shows the relationship between the journey length and the cost of trip per mile. The curve becomes flatter because as the journey length increases,
(Multiple Choice)
4.8/5 (38)
You have data for sales of pizza for each of the 50 states in 2011. The type of graph to best display these data would be a
(Multiple Choice)
4.8/5 (28)
Filters
- Essay(0)
- Multiple Choice(0)
- Short Answer(0)
- True False(0)
- Matching(0)