Exam 1: Getting Started
Exam 1: Getting Started200 Questions
Exam 2: The Us and Global Economies199 Questions
Exam 3: The Economic Problem99 Questions
Exam 4: Demand and Supply140 Questions
Exam 5: GDP: a Measure of Total Production and Income131 Questions
Exam 6: Jobs and Unemployment149 Questions
Exam 7: The Cpi and the Cost of Living101 Questions
Exam 8: Potential Gdp and the Natural Unemployment Rate153 Questions
Exam 9: Economic Growth152 Questions
Exam 10: Finance, Saving, and Investment151 Questions
Exam 11: The Monetary System129 Questions
Exam 12: Money, Interest, and Inflation130 Questions
Exam 13: Aggregate Supply Ad Aggregate Demand135 Questions
Exam 14: Aggregate Expenditure Multiplier72 Questions
Exam 15: The Short-Run Policy Tradeoff111 Questions
Exam 16: Fiscal Policy133 Questions
Exam 17: Monetary Policy106 Questions
Exam 18: International Trade Policy93 Questions
Exam 19: International Finance86 Questions
Select questions type
Which of the following is true regarding this statement? "The president's decision to spend more money on national defense is smart."
(Multiple Choice)
4.9/5  (34)
(34)
The decision to go to graduate school is a rational one for a college student if the
(Multiple Choice)
4.7/5 (40)
A choice made by comparing all relevant alternatives systematically and incrementally is
(Multiple Choice)
4.8/5 (29)
Jamie has enough money to buy either a Mountain Dew, or a Pepsi, or a bag of chips. He chooses to buy the Mountain Dew. The opportunity cost of the Mountain Dew is
(Multiple Choice)
4.7/5 (34)
Most economic graphs have two lines perpendicular to each other. Where these lines meet is called the
(Multiple Choice)
4.8/5 (41)
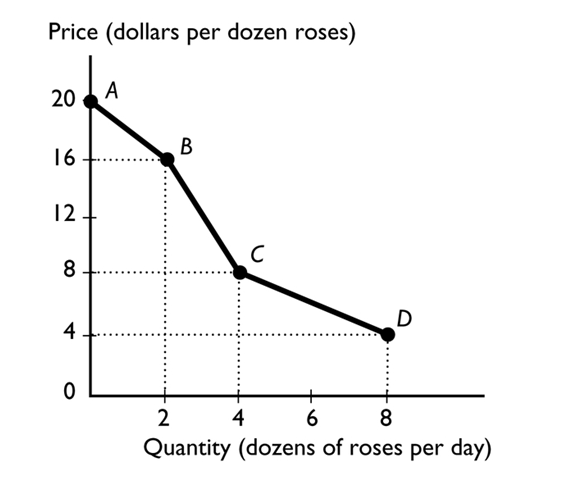 The figure above shows the relationship between the price of a dozen roses and the quantity of roses a florist can sell. The slope between points A and B is
(Multiple Choice)
4.9/5 (39)
A graph that shows the value of an economic variable for different groups in a population at a given time is called a
(Multiple Choice)
4.8/5 (33)
If a small change in the x variable results in a large change in the y variable, the curve will be
(Multiple Choice)
4.9/5 (34)
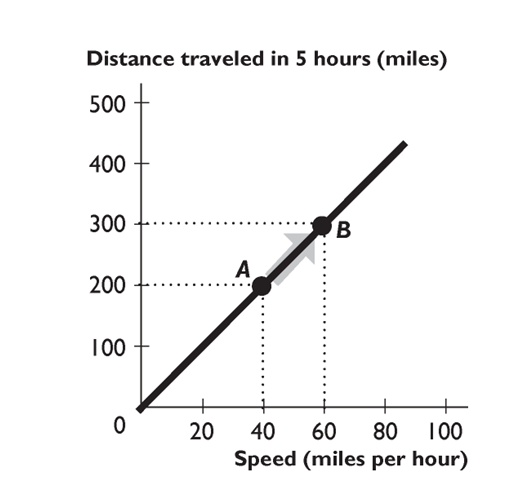 The relationship between distance traveled in five hours and speed shown in the figure above is
(Multiple Choice)
4.8/5 (33)
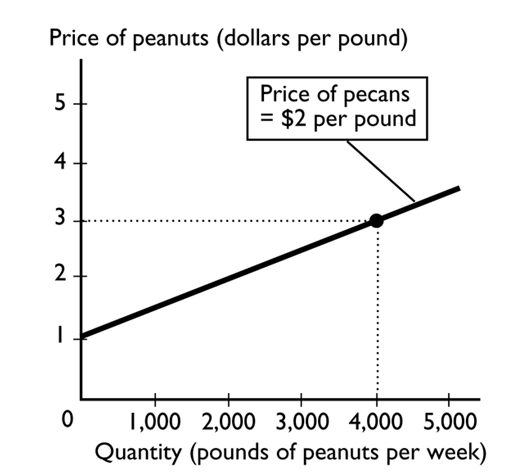 In the figure above, suppose the price of a pound of pecans is negatively related to the quantity of peanuts that farmers are willing to supply. If the price of pecans increases,
(Multiple Choice)
4.9/5 (33)
When economists use the term "correlation," they are referring to
(Multiple Choice)
4.8/5 (35)
When unskilled teens earn less than college graduates, society answers the-------------------- question.
(Multiple Choice)
4.8/5 (38)
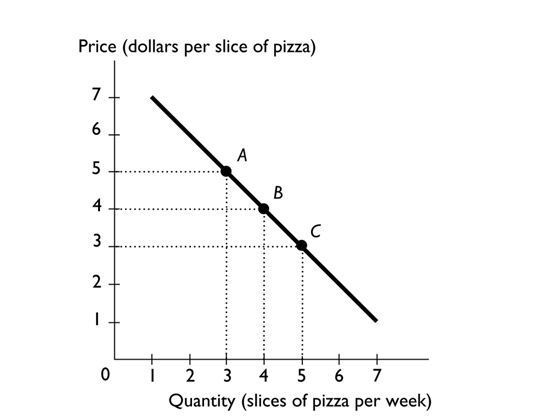 The above figure shows the relationship between the price of a slice of pizza and how many slices of pizza Ricardo buys in a week. Between points A and B, the slope of the line is-------------------- the slope of the line between points B and C.
(Multiple Choice)
4.8/5 (44)
Filters
- Essay(0)
- Multiple Choice(0)
- Short Answer(0)
- True False(0)
- Matching(0)