Exam 5: Elasticity and Its Application
Exam 1: Ten Principles of Economics455 Questions
Exam 2: Thinking Like an Economist643 Questions
Exam 3: Interdependence and the Gains From Trade547 Questions
Exam 4: The Market Forces of Supply and Demand693 Questions
Exam 5: Elasticity and Its Application626 Questions
Exam 6: Supply, Demand, and Government Policies668 Questions
Exam 7: Consumers, Producers, and the Efficiency of Markets547 Questions
Exam 8: Applications: the Costs of Taxation509 Questions
Exam 9: Application: International Trade521 Questions
Exam 10: Externalities543 Questions
Exam 11: Public Goods and Common Resources452 Questions
Exam 12: The Design of the Tax System664 Questions
Exam 13: The Costs of Production649 Questions
Exam 14: Firms in Competitive Markets604 Questions
Exam 15: Monopoly662 Questions
Exam 16: Monopolistic Competition649 Questions
Exam 17: Oligopoly522 Questions
Exam 18: The Markets for the Factors of Production592 Questions
Exam 19: Earnings and Discrimination511 Questions
Exam 20: Income Inequality and Poverty478 Questions
Exam 21: The Theory of Consumer Choice570 Questions
Exam 22: Frontiers in Microeconomics461 Questions
Exam 23: Measuring a Nation S Income547 Questions
Exam 24: Measuring the Cost of Living565 Questions
Exam 25: Production and Growth527 Questions
Exam 26: Saving, Investment, and the Financial System637 Questions
Exam 27: Tools of Finance534 Questions
Exam 28: Unemployment and Its Natural Rate701 Questions
Exam 29: The Monetary System540 Questions
Exam 30: Money Growth and Inflation504 Questions
Exam 31: Open-Economy Macroeconomics: Basic Concepts540 Questions
Exam 32: A Macroeconomic Theory of the Open Economy511 Questions
Exam 33: Aggregate Demand and Aggregate Supply572 Questions
Exam 34: The Influence of Monetary and Fiscal Policy on Aggregate Demand523 Questions
Exam 35: The Short-Run Tradeoff Between Inflation and Unemployment536 Questions
Exam 36: Six Debates Over Macroeconomic Policy354 Questions
Select questions type
Figure 5-5 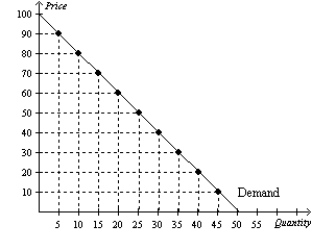 -Refer to Figure 5-5. At a price of $50 per unit, sellers' total revenue equals
(Multiple Choice)
4.8/5  (29)
(29)
Holding all other forces constant, if decreasing the price of a good leads to a decrease in total revenue, then the demand for the good must be
(Multiple Choice)
4.9/5 (31)
Scenario 5-1
Suppose that when the average college student's income is $10,000 per year, the annual quantity demanded of Patty's Pizza is 50 and the annual quantity demanded of Sue's Subs is 80. Suppose that when the price of Patty's Pizza increases from $8 to $10 per pie, the quantity demanded of Sue's Subs increases from 80 to 100. Suppose also that when the average student's income increases to $12,000 per year, the annual quantity demanded of Patty's Pizza increases from 50 to 60.
-Refer to Scenario 5-1. Using the midpoint method, the cross price elasticity of demand is
(Multiple Choice)
4.9/5 (29)
Figure 5-4 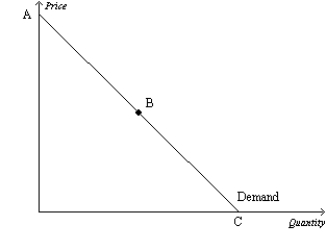 -Refer to Figure 5-4. If the price increases in the region of the demand curve between points B and C, we can expect total revenue to
(Multiple Choice)
5.0/5 (35)
Suppose you manage a baseball stadium. To pay the salary for a star player, you would like to increase the total revenue from ticket sales. Should you increase or decrease the price of a ticket to increase revenue? Explain.
(Essay)
4.8/5 (28)
When studying how some event or policy affects a market, elasticity provides information on the
(Multiple Choice)
4.8/5 (39)
If the price elasticity of supply is 0.4, and a price increase led to a 5% increase in quantity supplied, then the price increase is about
(Multiple Choice)
4.8/5 (43)
Figure 5-8 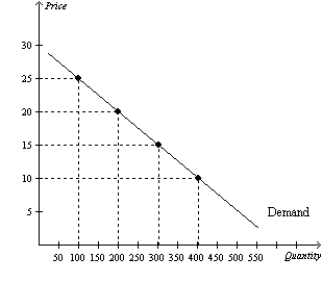 -Refer to Figure 5-8. An increase in price from $15 to $20 would
(Multiple Choice)
4.7/5 (34)
Suppose demand is given by the equation:  Using the midpoint method, what is the price elasticity of demand between $2 and $4?
(Short Answer)
4.9/5 (27)
Suppose that good X has few close substitutes and that good Y has many close substitutes. Which good would you expect to have more price inelastic demand?
(Short Answer)
4.7/5 (34)
The production of methamphetamine (meth) is a social problem in the Midwest. Iowa is considering two potential programs: Operation Methbust would increase the number of sheriffs' deputies to search out and destroy methamphetamine labs. Operation Say No to Meth would increase the training required of public school teachers so that they could better educate students about the health risks of using meth. Assuming that each program were successful, which of the following statements is correct?
(Multiple Choice)
5.0/5 (40)
If a 20% increase in price for a good results in a 15% decrease in quantity demanded, the price elasticity of demand is
(Multiple Choice)
4.9/5 (31)
If the demand for bananas is elastic, then an increase in the price of bananas will
(Multiple Choice)
4.7/5 (34)
Table 5-10

-Refer to Table 5-10. Using the midpoint method, which of the three supply curves has the most inelastic price elasticity of supply?
-Refer to Table 5-10. Using the midpoint method, which of the three supply curves has the most inelastic price elasticity of supply?
(Multiple Choice)
4.8/5 (24)
Figure 5-3 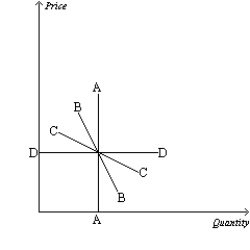 -Refer to Figure 5-3. Which demand curve is unit elastic?
(Multiple Choice)
4.9/5 (33)
Figure 5-3
-Refer to Figure 5-3. Jenna says she would buy 10 gallons of gas per week regardless of the price. If this is true, then Jenna's demand for gas is represented by demand curve
(Multiple Choice)
4.8/5 (37)
Moving downward and to the right along a linear demand curve, we know that total revenue
(Multiple Choice)
4.8/5 (42)
If marijuana were legalized, it is likely that there would be an increase in the supply of marijuana. Advocates of marijuana legalization argue that this would significantly reduce the amount of revenue going to the criminal organizations that currently supply marijuana. These advocates believe that the
(Multiple Choice)
4.9/5 (40)
Filters
- Essay(0)
- Multiple Choice(0)
- Short Answer(0)
- True False(0)
- Matching(0)