Exam 5: Elasticity and Its Application
Exam 1: Ten Principles of Economics455 Questions
Exam 2: Thinking Like an Economist643 Questions
Exam 3: Interdependence and the Gains From Trade547 Questions
Exam 4: The Market Forces of Supply and Demand693 Questions
Exam 5: Elasticity and Its Application626 Questions
Exam 6: Supply, Demand, and Government Policies668 Questions
Exam 7: Consumers, Producers, and the Efficiency of Markets547 Questions
Exam 8: Applications: the Costs of Taxation509 Questions
Exam 9: Application: International Trade521 Questions
Exam 10: Externalities543 Questions
Exam 11: Public Goods and Common Resources452 Questions
Exam 12: The Design of the Tax System664 Questions
Exam 13: The Costs of Production649 Questions
Exam 14: Firms in Competitive Markets604 Questions
Exam 15: Monopoly662 Questions
Exam 16: Monopolistic Competition649 Questions
Exam 17: Oligopoly522 Questions
Exam 18: The Markets for the Factors of Production592 Questions
Exam 19: Earnings and Discrimination511 Questions
Exam 20: Income Inequality and Poverty478 Questions
Exam 21: The Theory of Consumer Choice570 Questions
Exam 22: Frontiers in Microeconomics461 Questions
Exam 23: Measuring a Nation S Income547 Questions
Exam 24: Measuring the Cost of Living565 Questions
Exam 25: Production and Growth527 Questions
Exam 26: Saving, Investment, and the Financial System637 Questions
Exam 27: Tools of Finance534 Questions
Exam 28: Unemployment and Its Natural Rate701 Questions
Exam 29: The Monetary System540 Questions
Exam 30: Money Growth and Inflation504 Questions
Exam 31: Open-Economy Macroeconomics: Basic Concepts540 Questions
Exam 32: A Macroeconomic Theory of the Open Economy511 Questions
Exam 33: Aggregate Demand and Aggregate Supply572 Questions
Exam 34: The Influence of Monetary and Fiscal Policy on Aggregate Demand523 Questions
Exam 35: The Short-Run Tradeoff Between Inflation and Unemployment536 Questions
Exam 36: Six Debates Over Macroeconomic Policy354 Questions
Select questions type
Figure 5-18 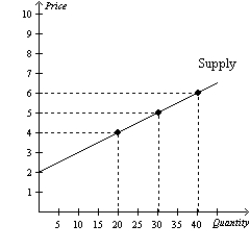 -Refer to Figure 5-18. Using the midpoint method, what is the price elasticity of supply between $4 and $5?
(Multiple Choice)
4.8/5  (40)
(40)
Which of the following statements about the consumers' responses to rising gasoline prices is correct?
(Multiple Choice)
4.8/5 (43)
Table 5-5 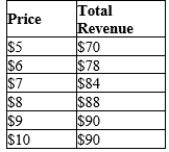 -Refer to Table 5-5. When price is between $5 and $9, demand is
(Multiple Choice)
4.8/5 (33)
For a particular good, an 8 percent increase in price causes a 4 percent decrease in quantity demanded. Which of the following statements is most likely applicable to this good?
(Multiple Choice)
4.9/5 (32)
Supply tends to be more elastic in the short run and more inelastic in the long run.
(True/False)
4.8/5 (37)
Table 5-9
 -Refer to Table 5-9. Which of the three supply curves represents the most elastic supply?
(Multiple Choice)
4.7/5 (37)
An advance in farm technology that results in an increased market supply is
(Multiple Choice)
4.8/5 (34)
Figure 5-5 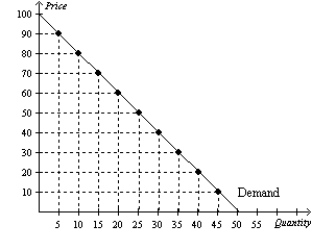 -Refer to Figure 5-5. At a price of $10 per unit, sellers' total revenue equals
(Multiple Choice)
4.8/5 (28)
If the quantity supplied is the same regardless of price, then supply is
(Multiple Choice)
4.7/5 (49)
Which of the following is likely to have the most price elastic demand?
(Multiple Choice)
4.9/5 (33)
If the income elasticity of demand for a good is negative, then the good must be an inferior good.
(True/False)
4.8/5 (26)
Holding all other forces constant, when the price of gasoline rises, the number of gallons of gasoline demanded would fall substantially over a ten-year period because
(Multiple Choice)
4.8/5 (31)
A t-shirt maker would be willing to supply 75 t-shirts per day at a price of $18.00 each. At a price of $20.00, the t-shirt maker would be willing to supply 100 t-shirts. Using the midpoint method, the price elasticity of supply for t-shirts is about
(Multiple Choice)
4.8/5 (34)
Figure 5-12 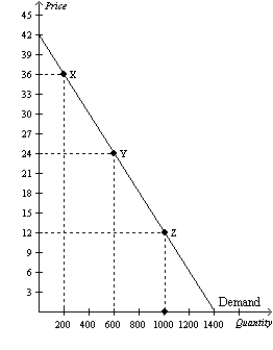 -Refer to Figure 5-12. Which of the following price changes would result in no change in sellers' total revenue?
(Multiple Choice)
4.7/5 (39)
If a 30 percent change in price causes a 15 percent change in quantity supplied, then the price elasticity of supply is about
(Multiple Choice)
4.8/5 (32)
Farm programs that pay farmers not to plant crops on all their land
(Multiple Choice)
4.8/5 (24)
Table 5-4
The following table shows the demand schedule for a particular good. 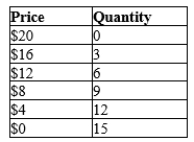 -Refer to Table 5-4. Using the midpoint method, when price rises from $8 to $12, the price elasticity of demand is
(Multiple Choice)
4.9/5 (43)
Figure 5-11 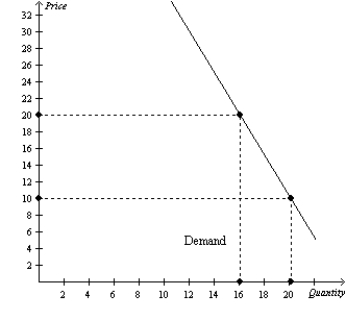 -Refer to Figure 5-11. A decrease in price from $20 to $10 leads to a
(Multiple Choice)
4.8/5 (28)
Supply and demand both tend to be more elastic in the long run and more inelastic in the short run.
(True/False)
4.9/5 (36)
Filters
- Essay(0)
- Multiple Choice(0)
- Short Answer(0)
- True False(0)
- Matching(0)