Exam 34: The Influence of Monetary and Fiscal Policy on Aggregate Demand
Exam 1: Ten Principles of Economics455 Questions
Exam 2: Thinking Like an Economist643 Questions
Exam 3: Interdependence and the Gains From Trade547 Questions
Exam 4: The Market Forces of Supply and Demand693 Questions
Exam 5: Elasticity and Its Application626 Questions
Exam 6: Supply, Demand, and Government Policies668 Questions
Exam 7: Consumers, Producers, and the Efficiency of Markets547 Questions
Exam 8: Applications: the Costs of Taxation509 Questions
Exam 9: Application: International Trade521 Questions
Exam 10: Externalities543 Questions
Exam 11: Public Goods and Common Resources452 Questions
Exam 12: The Design of the Tax System664 Questions
Exam 13: The Costs of Production649 Questions
Exam 14: Firms in Competitive Markets604 Questions
Exam 15: Monopoly662 Questions
Exam 16: Monopolistic Competition649 Questions
Exam 17: Oligopoly522 Questions
Exam 18: The Markets for the Factors of Production592 Questions
Exam 19: Earnings and Discrimination511 Questions
Exam 20: Income Inequality and Poverty478 Questions
Exam 21: The Theory of Consumer Choice570 Questions
Exam 22: Frontiers in Microeconomics461 Questions
Exam 23: Measuring a Nation S Income547 Questions
Exam 24: Measuring the Cost of Living565 Questions
Exam 25: Production and Growth527 Questions
Exam 26: Saving, Investment, and the Financial System637 Questions
Exam 27: Tools of Finance534 Questions
Exam 28: Unemployment and Its Natural Rate701 Questions
Exam 29: The Monetary System540 Questions
Exam 30: Money Growth and Inflation504 Questions
Exam 31: Open-Economy Macroeconomics: Basic Concepts540 Questions
Exam 32: A Macroeconomic Theory of the Open Economy511 Questions
Exam 33: Aggregate Demand and Aggregate Supply572 Questions
Exam 34: The Influence of Monetary and Fiscal Policy on Aggregate Demand523 Questions
Exam 35: The Short-Run Tradeoff Between Inflation and Unemployment536 Questions
Exam 36: Six Debates Over Macroeconomic Policy354 Questions
Select questions type
Figure 34-9 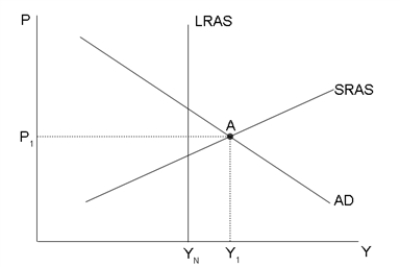 -Refer to Figure 34-9. Suppose the economy is currently at point A. To restore full employment, the Federal Reserve should
(Multiple Choice)
4.9/5  (37)
(37)
Which of the following shifts aggregate demand to the right?
(Multiple Choice)
4.9/5 (41)
If the Fed conducts open-market purchases, the money supply
(Multiple Choice)
4.8/5 (41)
Which of the following is likely more important for explaining the slope of the aggregate-demand curve of a small economy than it is for the United States?
(Multiple Choice)
4.9/5 (35)
In which of the following cases would the quantity of money demanded be smallest?
(Multiple Choice)
4.8/5 (36)
Figure 34-2. On the left-hand graph, MS represents the supply of money and MD represents the demand for money; on the right-hand graph, AD represents aggregate demand. The usual quantities are measured along the axes of both graphs.
. 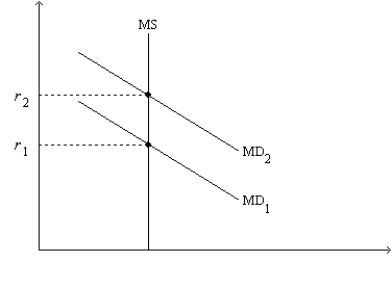
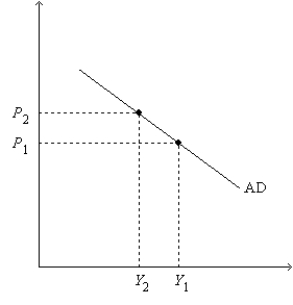 -Refer to Figure 34-2. What does Y represent on the horizontal axis of the right-hand graph?
(Multiple Choice)
4.9/5 (36)
According to the theory of liquidity preference, money demand
(Multiple Choice)
5.0/5 (34)
Figure 34-2. On the left-hand graph, MS represents the supply of money and MD represents the demand for money; on the right-hand graph, AD represents aggregate demand. The usual quantities are measured along the axes of both graphs.
.
-Refer to Figure 34-2. Assume the money market is always in equilibrium, and suppose r1 = 0.08; r2 = 0.12; Y1 = 13,000; Y2 = 10,000; P1 = 1.0; and P2 = 1.2. Which of the following statements is correct?
(Multiple Choice)
4.8/5 (41)
During recessions, the government tends to run a budget deficit.
(True/False)
4.9/5 (34)
The potential positive feedback that government spending may have on investment is known as the _____. The potential negative effect that government spending may have on investment is known as the _____ effect.
(Short Answer)
4.9/5 (41)
When the Fed increases the money supply, the interest rate decreases. This decrease in the interest rate increases consumption and investment demand, so the aggregate-demand curve shifts to the right.
(True/False)
4.8/5 (40)
A decrease in taxes will shift aggregate demand to the _____, cause consumption to _____, and cause output to _____. Due to the crowding-out effect, investment will _____.
(Short Answer)
4.8/5 (37)
Which of the following Fed actions would both decrease the money supply?
(Multiple Choice)
4.8/5 (29)
An increase in the price level shifts the money demand curve to the left, causing interest rates to increase.
(True/False)
4.8/5 (33)
If Congress increases taxes to balance the federal budget, then to prevent additional unemployment and a recession the Fed can
(Multiple Choice)
4.7/5 (38)
Filters
- Essay(0)
- Multiple Choice(0)
- Short Answer(0)
- True False(0)
- Matching(0)