Exam 34: The Influence of Monetary and Fiscal Policy on Aggregate Demand
Exam 1: Ten Principles of Economics455 Questions
Exam 2: Thinking Like an Economist643 Questions
Exam 3: Interdependence and the Gains From Trade547 Questions
Exam 4: The Market Forces of Supply and Demand693 Questions
Exam 5: Elasticity and Its Application626 Questions
Exam 6: Supply, Demand, and Government Policies668 Questions
Exam 7: Consumers, Producers, and the Efficiency of Markets547 Questions
Exam 8: Applications: the Costs of Taxation509 Questions
Exam 9: Application: International Trade521 Questions
Exam 10: Externalities543 Questions
Exam 11: Public Goods and Common Resources452 Questions
Exam 12: The Design of the Tax System664 Questions
Exam 13: The Costs of Production649 Questions
Exam 14: Firms in Competitive Markets604 Questions
Exam 15: Monopoly662 Questions
Exam 16: Monopolistic Competition649 Questions
Exam 17: Oligopoly522 Questions
Exam 18: The Markets for the Factors of Production592 Questions
Exam 19: Earnings and Discrimination511 Questions
Exam 20: Income Inequality and Poverty478 Questions
Exam 21: The Theory of Consumer Choice570 Questions
Exam 22: Frontiers in Microeconomics461 Questions
Exam 23: Measuring a Nation S Income547 Questions
Exam 24: Measuring the Cost of Living565 Questions
Exam 25: Production and Growth527 Questions
Exam 26: Saving, Investment, and the Financial System637 Questions
Exam 27: Tools of Finance534 Questions
Exam 28: Unemployment and Its Natural Rate701 Questions
Exam 29: The Monetary System540 Questions
Exam 30: Money Growth and Inflation504 Questions
Exam 31: Open-Economy Macroeconomics: Basic Concepts540 Questions
Exam 32: A Macroeconomic Theory of the Open Economy511 Questions
Exam 33: Aggregate Demand and Aggregate Supply572 Questions
Exam 34: The Influence of Monetary and Fiscal Policy on Aggregate Demand523 Questions
Exam 35: The Short-Run Tradeoff Between Inflation and Unemployment536 Questions
Exam 36: Six Debates Over Macroeconomic Policy354 Questions
Select questions type
When the government reduces taxes, which of the following decreases?
(Multiple Choice)
4.8/5  (37)
(37)
The wealth effect stems from the idea that a higher price level
(Multiple Choice)
4.8/5 (37)
Suppose the MPC is 0.60. Assume there are no crowding out or investment accelerator effects. If the government increases expenditures by $200 billion, then by how much does aggregate demand shift to the right? If the government decreases taxes by $200 billion, then by how much does aggregate demand shift to the right?
(Multiple Choice)
4.9/5 (37)
If the inflation rate is zero, then the nominal and real interest rate are the same.
(True/False)
4.8/5 (38)
Suppose that consumers become pessimistic about the future health of the economy. What will happen to aggregate demand and to output? What might the president and Congress have to do to keep output stable?
(Essay)
4.8/5 (33)
According to liquidity preference theory, an increase in the price level shifts the
(Multiple Choice)
4.8/5 (45)
Which of the following is not a reason the aggregate-demand curve slopes downward? As the price level increases,
(Multiple Choice)
4.9/5 (29)
According to the Theory of Liquidity Preference, a fall in the _____ reduces the amount of money that people wish to hold. As a result, falling interest rates stimulates investment spending and aggregate _____.
(Short Answer)
4.9/5 (46)
Which of the following events would shift money demand to the right?
(Multiple Choice)
4.8/5 (37)
The government increases both its expenditures and taxes by $400 billion. There is no crowding out and no accelerator effect. Aggregate demand shifts by $400 billion. Which of the following is consistent with how far aggregate demand shifts?
(Multiple Choice)
4.9/5 (35)
A tax cut targeted at ____ people may have a bigger effect because
(Multiple Choice)
4.9/5 (33)
Figure 34-4. On the figure, MS represents money supply and MD represents money demand. 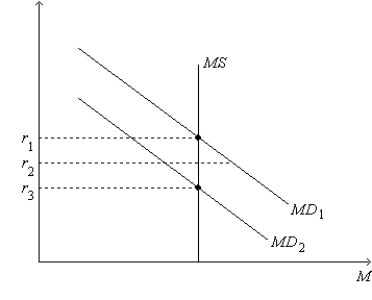 -Refer to Figure 34-4. Suppose the current equilibrium interest rate is r1. Let Y1 represent the corresponding quantity of goods and services demanded, and let P1 represent the corresponding price level. Starting from this situation, if the Federal Reserve increases the money supply and if the price level remains at P1, then
(Multiple Choice)
4.9/5 (33)
In the short run, an increase in the money supply causes interest rates to
(Multiple Choice)
4.9/5 (37)
Figure 34-2. On the left-hand graph, MS represents the supply of money and MD represents the demand for money; on the right-hand graph, AD represents aggregate demand. The usual quantities are measured along the axes of both graphs.
. 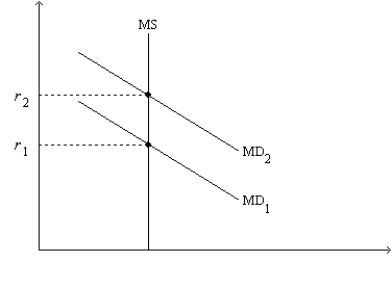
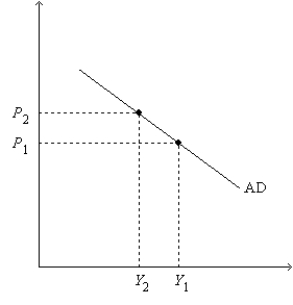 -Refer to Figure 34-2. Assume the money market is always in equilibrium, and suppose r1 = 0.08; r2 = 0.12; Y1 = 13,000; Y2 = 10,000; P1 = 1.0; and P2 = 1.2. Which of the following statements is correct? When P = P2,
(Multiple Choice)
4.8/5 (37)
Other things equal, the higher the price level, the higher is the real wealth of households.
(True/False)
4.8/5 (32)
Filters
- Essay(0)
- Multiple Choice(0)
- Short Answer(0)
- True False(0)
- Matching(0)