Exam 14: Business Analytics
Exam 1: Defining and Collecting Data205 Questions
Exam 2: Organizing and Visualizing Variables212 Questions
Exam 3: Numerical Descriptive Measures163 Questions
Exam 4: Basic Probability171 Questions
Exam 5: Discrete Probability Distributions117 Questions
Exam 6: The Normal Distribution144 Questions
Exam 7: Sampling Distributions127 Questions
Exam 8: Confidence Interval Estimation187 Questions
Exam 9: Fundamentals of Hypothesis Testing: One-Sample Tests177 Questions
Exam 10: Two-Sample Tests300 Questions
Exam 11: Chi-Square Tests128 Questions
Exam 12: Simple Linear Regression209 Questions
Exam 13: Multiple Regression307 Questions
Exam 14: Business Analytics254 Questions
Select questions type
SCENARIO 15-5
A manufacturer of computer disks took samples of 240 disks on 15 consecutive days.The number of disks with bad sectors was determined for each of these samples.The results are in the table that follows. \% 1 9 0.037500 2 7 0.029167 3 4 0.016667 4 6 0.025000 5 8 0.033333 6 3 0.012500 7 6 0.025000 8 10 0.041667 9 16 0.066667 10 24 0.100000 11 15 0.062500 12 9 0.037500 13 4 0.016667 14 8 0.033333 15 6 0.025000
-Referring to SCENARIO 15-5, construct a p control chart for these data.
Free
(Short Answer)
4.9/5  (42)
(42)
Correct Answer: Verified
Proportion of Bad Disks in Samples of Size 240 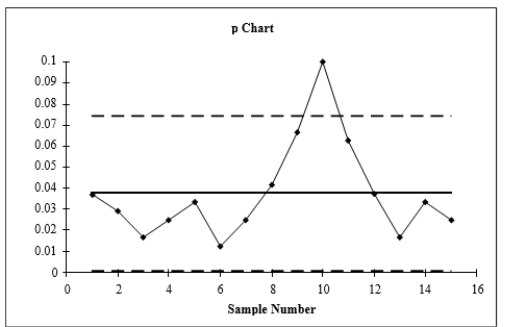
SCENARIO 15-4
A factory supervisor is concerned that the time it takes workers to complete an important production task (measured in seconds) is too erratic and adversely affects expected profits.The supervisor proceeds by randomly sampling 5 individuals per hour for a period of 10 hours.The sample mean and range for each hour are listed below.
 1 18.4 25 2 16.9 27 3 23.0 30 4 21.2 23 5 21.0 24 6 24.0 25 7 19.3 12 8 15.8 14 9 20.0 13 10 23.0 11 She also decides that lower and upper specification limit for the critical-to-quality variable should be
10 and 30 seconds, respectively.
-Referring to SCENARIO 15-4, what is the value of d2 factor?
1 18.4 25 2 16.9 27 3 23.0 30 4 21.2 23 5 21.0 24 6 24.0 25 7 19.3 12 8 15.8 14 9 20.0 13 10 23.0 11 She also decides that lower and upper specification limit for the critical-to-quality variable should be
10 and 30 seconds, respectively.
-Referring to SCENARIO 15-4, what is the value of d2 factor?
Free
(Short Answer)
5.0/5 (43)
Correct Answer:Verified
2.326
Multilayer perceptrons usually contain an input layer, a hidden layer and an output layer.
Free
(True/False)
4.9/5 (32)
Correct Answer:Verified
True
SCENARIO 14-4
The regression tree below was obtained for predicting the weekend box office revenue of a newly released movie (in thousands of dollars) based on data collected in different cities on the expenditure (at $25, $30, $35, $40, $45, $50, $55, $60, $65 or $70 thousand) spent on TV advertising and the number of times (10, 15, 20, 25, 30 or 35) a day the advertisement appear on TV. 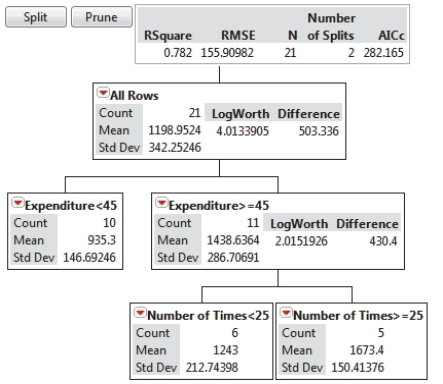 -Referring to SCENARIO 14-4, the highest mean weekend box office revenue is predicted to occur with less than $45 thousand spent on TV advertisement and fewer than 25 advertisement appearances a day.
(True/False)
4.7/5 (32)
SCENARIO 14-1
The table below contains the sparklines for the rates of return (in percentage) for three different stocks from 2007 to 2013. 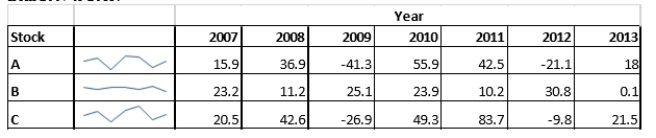 -Referring to SCENARIO 14-1, the sparklines enable you to conclude that the rates of return of the stock market in general are volatile from 2007 to 2013.
(True/False)
4.9/5 (22)
SCENARIO 15-8
Recently, a university switched to a new type of computer-based registration.The registrar is concerned with the amount of time (hours) students are spending on the computer registering under the new system.She decides to randomly select 8 students on each of the 12 days of the registration and determine the time each spends on the computer registering.The range, mean, and standard deviation of the times required to register are in the table that follows. 1 10 5.250 3.4949 2 31 15.250 10.3060 3 13 20.375 4.9262 4 21 22.875 8.3911 5 35 8.500 11.3767 6 18 7.875 6.9372 7 25 11.250 8.5815 8 30 7.875 9.5235 9 17 10.250 6.3640 10 22 9.500 7.8740 11 27 7.875 8.7086 12 26 12.875 9.3723
-Referring to SCENARIO 15-8, an X chart is to be used for the time required to register.One way to obtain the control limits is to take the grand mean and add and subtract the product of A2 times the mean of the sample ranges.For this data set, the value of A2 is . 
(Short Answer)
4.9/5 (35)
Quick Changeover Techniques establish ways to eliminate unnecessary housekeeping aspects of a work environment.
(True/False)
4.8/5 (35)
TPM establishes ways to clean and maintain the necessary housekeeping aspects of a work environment.
(True/False)
4.9/5 (30)
SCENARIO 15-7
A supplier of silicone sheets for producers of computer chips wants to evaluate her manufacturing process.She takes samples of size 5 from each day's output and counts the number of blemishes on each silicone sheet.The results from 20 days of such evaluations are presented below. 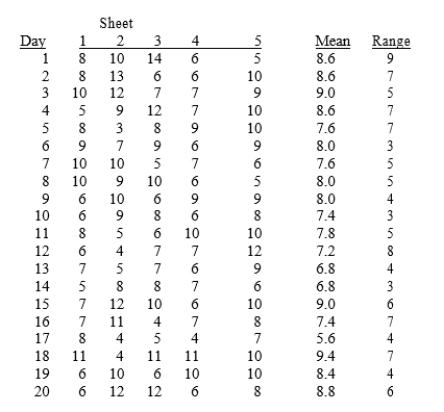 She also decides that the upper specification limit is 10 blemishes.
-Referring to SCENARIO 15-7, an X chart is to be used for the number of blemishes.The center line of this chart is located at _.
She also decides that the upper specification limit is 10 blemishes.
-Referring to SCENARIO 15-7, an X chart is to be used for the number of blemishes.The center line of this chart is located at _. 
(Short Answer)
4.9/5 (40)
SCENARIO 15-4
A factory supervisor is concerned that the time it takes workers to complete an important production task (measured in seconds) is too erratic and adversely affects expected profits.The supervisor proceeds by randomly sampling 5 individuals per hour for a period of 10 hours.The sample mean and range for each hour are listed below.
1 18.4 25 2 16.9 27 3 23.0 30 4 21.2 23 5 21.0 24 6 24.0 25 7 19.3 12 8 15.8 14 9 20.0 13 10 23.0 11 She also decides that lower and upper specification limit for the critical-to-quality variable should be
10 and 30 seconds, respectively.
-Referring to SCENARIO 15-4, suppose the supervisor constructs an R chart to see if the variability in collection times is in-control.What is the center line of this R chart?
(Multiple Choice)
4.7/5 (32)
SCENARIO 15-1
A local newspaper has 10 delivery boys who each deliver the morning paper to 50 customers every day.The owner decides to record the number of papers delivered on time for a 10-day period for one of the delivery boys and construct a p chart to see whether the percentage is too erratic. Day Number of Papers DeliveredonTime 1 46 2 45 3 46 4 45 5 43 6 48 7 46 8 49 9 48 10 47
-Referring to SCENARIO 15-1, what is the numerical value of the center line for the p chart?
(Multiple Choice)
4.8/5 (40)
Variation due to the inherent variability in a system of operation is called
(Multiple Choice)
4.9/5 (34)
SCENARIO 15-5
A manufacturer of computer disks took samples of 240 disks on 15 consecutive days.The number of disks with bad sectors was determined for each of these samples.The results are in the table that follows. \% 1 9 0.037500 2 7 0.029167 3 4 0.016667 4 6 0.025000 5 8 0.033333 6 3 0.012500 7 6 0.025000 8 10 0.041667 9 16 0.066667 10 24 0.100000 11 15 0.062500 12 9 0.037500 13 4 0.016667 14 8 0.033333 15 6 0.025000
-Referring to SCENARIO 15-5, the process seems to be in control.
(True/False)
4.9/5 (32)
SCENARIO 15-9
The manufacturer of canned food constructed control charts and analyzed several quality characteristics.One characteristic of interest is the weight of the filled cans.The lower specification limit for weight is 2.95 pounds.The table below provides the range and mean of the weights of five cans tested every fifteen minutes during a day's production. Number XBar Range Number XBar Range 1 3.05072 0.0215 16 3.04646 0.073 2 3.01228 0.087 17 3.03868 0.0696 3 3.03558 0.0851 18 3.03338 0.0329 4 3.01014 0.0674 19 3.03322 0.0455 5 3.00858 0.0983 20 3.05078 0.0215 6 3.02704 0.0527 21 3.04808 0.0396 7 3.04268 0.0508 22 3.05348 0.0581 8 3.01052 0.0791 23 3.05516 0.0682 9 3.03464 0.0663 24 3.03426 0.0325 10 3.02034 0.0538 25 3.0516 0.0641 11 3.03764 0.0584 26 3.05562 0.0809 12 3.0409 0.0434 27 3.04402 0.0374 13 3.0519 0.0762 28 3.06458 0.0284 14 3.03994 0.0833 29 3.0544 0.0738 15 3.03788 0.0601
-Referring to SCENARIO 15-9, construct an R chart for the time required to register.
(Short Answer)
4.9/5 (32)
SCENARIO 14-4
The regression tree below was obtained for predicting the weekend box office revenue of a newly released movie (in thousands of dollars) based on data collected in different cities on the expenditure (at $25, $30, $35, $40, $45, $50, $55, $60, $65 or $70 thousand) spent on TV advertising and the number of times (10, 15, 20, 25, 30 or 35) a day the advertisement appear on TV.
-Referring to SCENARIO 14-4, the first split occurs at $45 thousand spent on TVadvertising.
(True/False)
4.7/5 (25)
The SS method establishes ways to eliminate unnecessary housekeeping aspects of a work environment.
(True/False)
4.9/5 (40)
Total Production Maintenance is among the tools of Lean Six Sigma.
(True/False)
4.9/5 (32)
SCENARIO 15-9
The manufacturer of canned food constructed control charts and analyzed several quality characteristics.One characteristic of interest is the weight of the filled cans.The lower specification limit for weight is 2.95 pounds.The table below provides the range and mean of the weights of five cans tested every fifteen minutes during a day's production. Number XBar Range Number XBar Range 1 3.05072 0.0215 16 3.04646 0.073 2 3.01228 0.087 17 3.03868 0.0696 3 3.03558 0.0851 18 3.03338 0.0329 4 3.01014 0.0674 19 3.03322 0.0455 5 3.00858 0.0983 20 3.05078 0.0215 6 3.02704 0.0527 21 3.04808 0.0396 7 3.04268 0.0508 22 3.05348 0.0581 8 3.01052 0.0791 23 3.05516 0.0682 9 3.03464 0.0663 24 3.03426 0.0325 10 3.02034 0.0538 25 3.0516 0.0641 11 3.03764 0.0584 26 3.05562 0.0809 12 3.0409 0.0434 27 3.04402 0.0374 13 3.0519 0.0762 28 3.06458 0.0284 14 3.03994 0.0833 29 3.0544 0.0738 15 3.03788 0.0601
-Referring to SCENARIO 15-9, an R chart is to be constructed for the weight.The lower control limit for this data set is .
(Short Answer)
4.7/5 (48)
Filters
- Essay(0)
- Multiple Choice(0)
- Short Answer(0)
- True False(0)
- Matching(0)