Exam 3: Numerical Descriptive Measures
Exam 1: Defining and Collecting Data205 Questions
Exam 2: Organizing and Visualizing Variables212 Questions
Exam 3: Numerical Descriptive Measures163 Questions
Exam 4: Basic Probability171 Questions
Exam 5: Discrete Probability Distributions117 Questions
Exam 6: The Normal Distribution144 Questions
Exam 7: Sampling Distributions127 Questions
Exam 8: Confidence Interval Estimation187 Questions
Exam 9: Fundamentals of Hypothesis Testing: One-Sample Tests177 Questions
Exam 10: Two-Sample Tests300 Questions
Exam 11: Chi-Square Tests128 Questions
Exam 12: Simple Linear Regression209 Questions
Exam 13: Multiple Regression307 Questions
Exam 14: Business Analytics254 Questions
Select questions type
SCENARIO 3-1
Health care issues are receiving much attention in both academic and political arenas.A sociologist recently conducted a survey of citizens over 60 years of age whose net worth is too high to qualify for Medicaid.The ages of 25 senior citizens were as follows: 60 61 62 63 64 65 66 68 68 69 70 73 73 74 75 76 76 81 81 82 86 87 89 90 92
-Referring to Scenario 3-1 determine the first quartile of the ages of the senior citizens.
Free
(Short Answer)
4.8/5  (41)
(41)
Correct Answer: Verified
65.5 years
SCENARIO 3-1
Health care issues are receiving much attention in both academic and political arenas.A sociologist recently conducted a survey of citizens over 60 years of age whose net worth is too high to qualify for Medicaid.The ages of 25 senior citizens were as follows: 60 61 62 63 64 65 66 68 68 69 70 73 73 74 75 76 76 81 81 82 86 87 89 90 92
-Referring to Scenario 3-1, calculate the kurtosis statistic for the age of the senior citizens accurate to two decimal places.
Free
(Short Answer)
4.7/5 (34)
Correct Answer:Verified
-1.01
SCENARIO 3-11
Given below are the closing prices for the Dow Jones Industrial Average (DJIA) and the Standard & Poor's (S&P) 500 Index over 10-weeks sometime in the past. Dow Jones 10,421 10,110 9,862 10,475 9,920 10,592 11,213 10,933 11,134 10,316 S\&P 500 1,379 1,356 1,343 1,410 1,389 1,463 1,529 1,499 1,516 1,355
-Referring to Scenario 3-11, what is the sample correlation coefficient between the DJIA and theS&P 500 index?
Free
(Short Answer)
4.8/5 (38)
Correct Answer:Verified
0.9274
SCENARIO 3-12
Given below are the rating and performance scores of 15 laptop computers.
Performance Score 115 191 153 194 236 184 184 216 Overall Rating 74 78 79 80 84 76 77 92 Performance Score 185 183 189 202 192 141 187 Overall Rating 83 78 77 78 78 73 77
-Referring to Scenario 3-12, what is the sample covariance between the performance scores and the rating?
(Short Answer)
4.9/5 (33)
SCENARIO 3-3
The ordered array below represents the number of vitamin supplements sold by a health food store in a sample of 16 days. Note: For this sample, the sum of the values is 448, and the sum of the squared differences between each value and the mean is 812.
-Referring to Scenario 3-3, construct a boxplot for the data in this sample.
(Short Answer)
4.9/5 (26)
SCENARIO 3-5
The rate of return of a Fortune 500 company over the past 15 years are: 3.17\%,4.43\%,5.93\%,5.43\%, 7.29\%,8.21\%,6.23\%,5.23\%,4.34\%,6.68\%,7.14\%,-5.56\%,-5.23\%,-5.73\%,-10.34\%
-Referring to Scenario 3-5, compute the geometric mean rate of return per year for the first four years.
(Short Answer)
5.0/5 (35)
SCENARIO 3-2
The data below represent the number of grams of carbohydrates in a serving of breakfast cereal in a sample of 11 different servings.
-Referring to Scenario 3-2, the first quartile of the carbohydrate amounts is grams.
(Short Answer)
4.8/5 (35)
The interquartile range is a measure of variation or dispersion in a set of data.
(True/False)
4.9/5 (33)
The coefficient of variation is a measure of relative variation.
(True/False)
4.8/5 (32)
SCENARIO 3-6
The rate of return of an Internet Service Provider over a 10-year period are: 10.25\%,12.64\%,8.37\%, 9.29\%,6.23\%,42.53\%,29.23\%,15.25\%,21.52\%,-2.35\% .
-Referring to Scenario 3-6, compute the geometric mean rate of return per year for the first three years.
(Short Answer)
4.7/5 (39)
Data on the change in the cost of tuition, a shared dormitory room, and the most popular meal plan from one academic year to the next academic year for a sample of 100 public universities are collected.Below is the boxplot for the change in cost in dollars.The distribution of the change in cost is 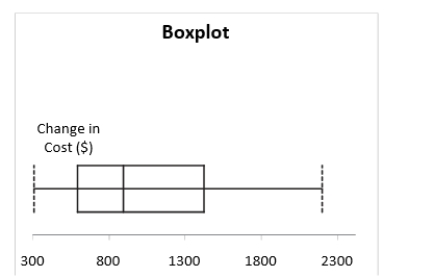
(Multiple Choice)
4.9/5 (31)
SCENARIO 3-6
The rate of return of an Internet Service Provider over a 10-year period are: 10.25\%,12.64\%,8.37\%, 9.29\%,6.23\%,42.53\%,29.23\%,15.25\%,21.52\%,-2.35\% .
-Referring to Scenario 3-6, construct a boxplot for the rate of return
(Short Answer)
4.7/5 (31)
SCENARIO 3-1
Health care issues are receiving much attention in both academic and political arenas.A sociologist recently conducted a survey of citizens over 60 years of age whose net worth is too high to qualify for Medicaid.The ages of 25 senior citizens were as follows: 60 61 62 63 64 65 66 68 68 69 70 73 73 74 75 76 76 81 81 82 86 87 89 90 92
-Referring to Scenario 3-1, determine which of the following is the correct statement.
(Multiple Choice)
4.9/5 (39)
The five-number summary consists of the smallest value, the first quartile, the median, the third quartile, and the largest value.
(True/False)
4.8/5 (31)
A boxplot is a graphical representation of a five-number summary.
(True/False)
4.8/5 (29)
The geometric mean is a measure of variation or dispersion in a set of data.
(True/False)
4.8/5 (41)
SCENARIO 3-3
The ordered array below represents the number of vitamin supplements sold by a health food store in a sample of 16 days. Note: For this sample, the sum of the values is 448, and the sum of the squared differences between each value and the mean is 812.
-Referring to Scenario 3-3, is the number of vitamin supplements sold in this sample right- or left- skewed?
(Short Answer)
4.7/5 (35)
SCENARIO 3-5
The rate of return of a Fortune 500 company over the past 15 years are: 3.17\%,4.43\%,5.93\%,5.43\%, 7.29\%,8.21\%,6.23\%,5.23\%,4.34\%,6.68\%,7.14\%,-5.56\%,-5.23\%,-5.73\%,-10.34\%
-Referring to Scenario 3-5, compute the arithmetic mean rate of return per year.
(Short Answer)
4.8/5 (41)
Filters
- Essay(0)
- Multiple Choice(0)
- Short Answer(0)
- True False(0)
- Matching(0)